
Is BTC About To Drop To $71,000 Or Explode Past $81,000?
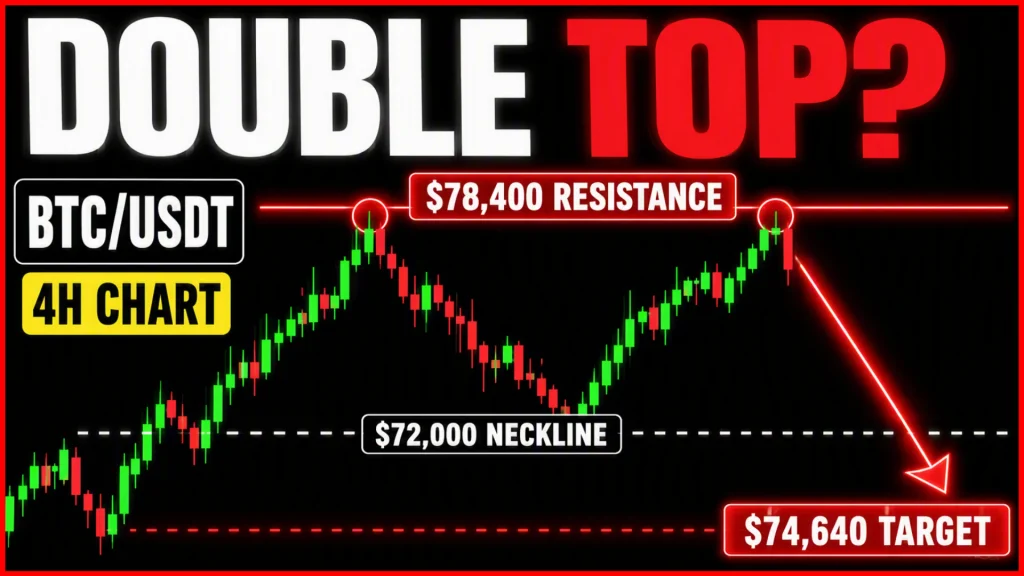
The Bitcoin market is at a critical turning point. After a strong rally that pushed prices up towards the $81,000 level, the king of cryptocurrency is now showing signs of exhaustion, and traders across the globe are watching closely to see which direction the next major move will come from.
In this article, we are going to break down the current Bitcoin price action in detail, look at what the technical indicators are telling us, identify the key price levels that could make or break the market in the coming days, and outline a clear trading plan that gives you the best chance of staying on the right side of the market.
Whether you are a seasoned Bitcoin trader or someone who is just starting to learn about technical analysis, this breakdown will give you a clear and actionable picture of where Bitcoin stands right now and where it could be headed next.
The Big Picture: Bitcoin Is Losing Steam
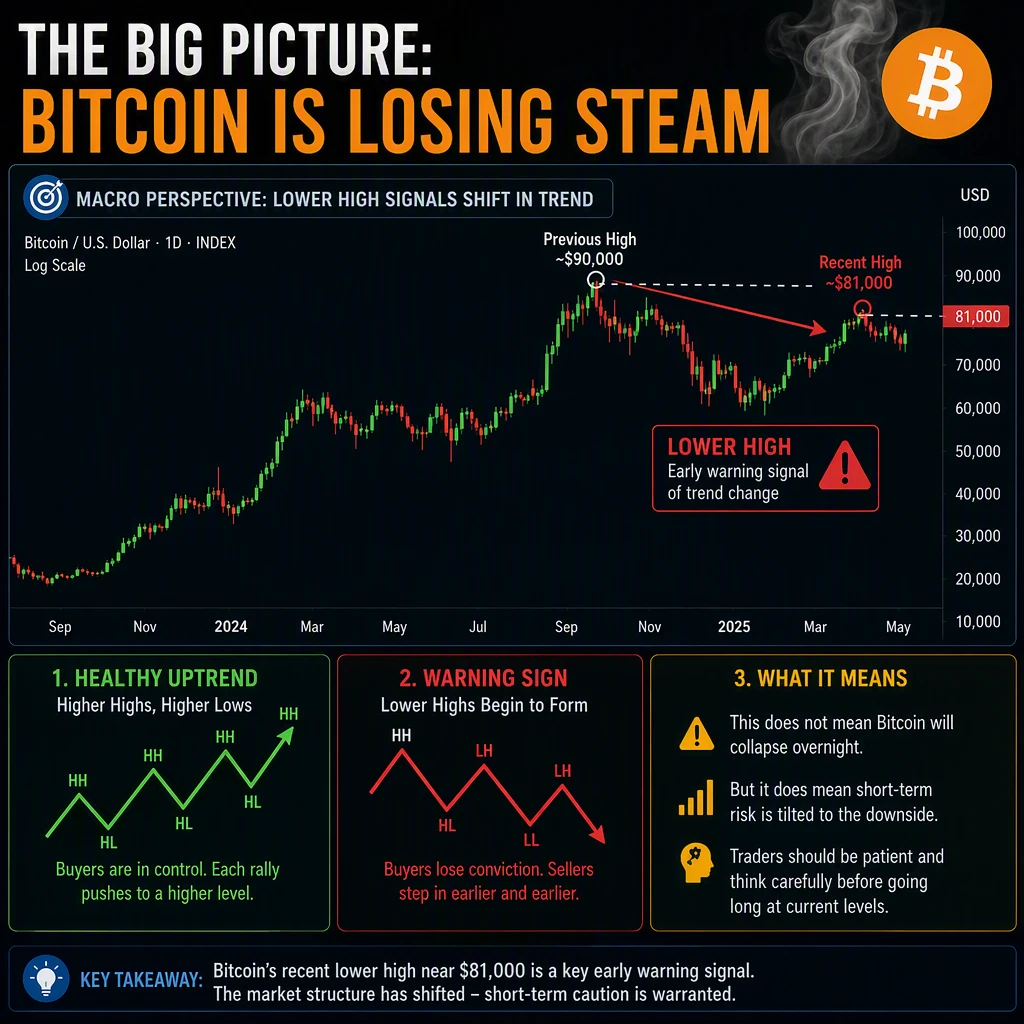
Let us start with the most important observation on the Bitcoin chart right now. When you zoom out and look at the recent price action from a macro perspective, something very telling becomes apparent.
Bitcoin recently made a push towards the $81,000 price level. However, this high was actually lower than the previous high that was set before it. In technical analysis terms, this is called a lower high, and it is one of the most reliable early warning signals that a market is beginning to transition from a bullish trend to a bearish one.
Think of it this way. When Bitcoin is in a healthy uptrend, each new rally should push the price to a higher point than the previous rally. That is what we call higher highs and higher lows, and it is the hallmark of a strong bull market. But when the price starts making lower highs, it tells us that the buyers are losing their conviction and that sellers are beginning to step in earlier and earlier.
This shift in market structure does not mean that Bitcoin is about to collapse overnight. But it does mean that the short term risk is tilted to the downside, and that traders should be thinking carefully before jumping into long positions at current levels.
Breaking Down The Trade Setup: Entry, Take Profit and Stop Loss
So what does this bearish structure mean in practical trading terms? Here is a detailed breakdown of the trade setup that makes sense given the current market conditions.
The Entry Level: $76,157
The key trigger level for a short trade entry is $76,157. This is not a random number. It represents a significant technical level on the Bitcoin chart where price structure suggests that if the market breaks below it with convincing momentum, the path to lower prices becomes much more likely.
The strategy here is simple. Watch the price action around the $76,200 area. If Bitcoin breaks below this level and shows follow through to the downside, that is the signal to enter a short position. Do not jump the gun and enter before the break. Wait for confirmation, because a false breakdown can quickly reverse and trap traders on the wrong side.
First Take Profit: $73,402
Once the trade is active and the price is moving in the anticipated direction, the first take profit target is $73,402. This level represents the first significant area of potential support where the price could pause, consolidate, or even bounce temporarily.
At this point, it is highly recommended to take at least partial profits. Locking in gains on a portion of your position is a smart move because it reduces your overall risk and ensures that you are walking away with something even if the trade reverses from this point.
Second Take Profit: $71,983
If the momentum continues and the indicators confirm further weakness, the second and more aggressive take profit target is $71,983. This is a deeper level of support and represents a more significant move to the downside.
Not every trade will reach this level. Market conditions change rapidly, and it is important to remain flexible and adjust your targets based on what the price action and volume are telling you in real time.

Stop Loss: The Non-Negotiable Rule
Here is something that cannot be stressed enough. Always use a stop loss. This is not optional. It is not something you can skip when you are feeling confident about a trade. It is the single most important risk management tool available to traders, and failing to use it is one of the most common reasons why traders blow up their accounts.
Place your stop loss above the entry point at a level that makes technical sense. And here is a pro tip that separates disciplined traders from gamblers: once you hit your first take profit at $73,402, immediately move your stop loss down to your entry point. This is called a breakeven stop, and it means that from that point forward, the worst possible outcome is that you break even on the trade. You have eliminated the possibility of a loss, and now you are playing with the markets money on the remainder of your position.
The Critical Support Zone: $75,000 To $80,000
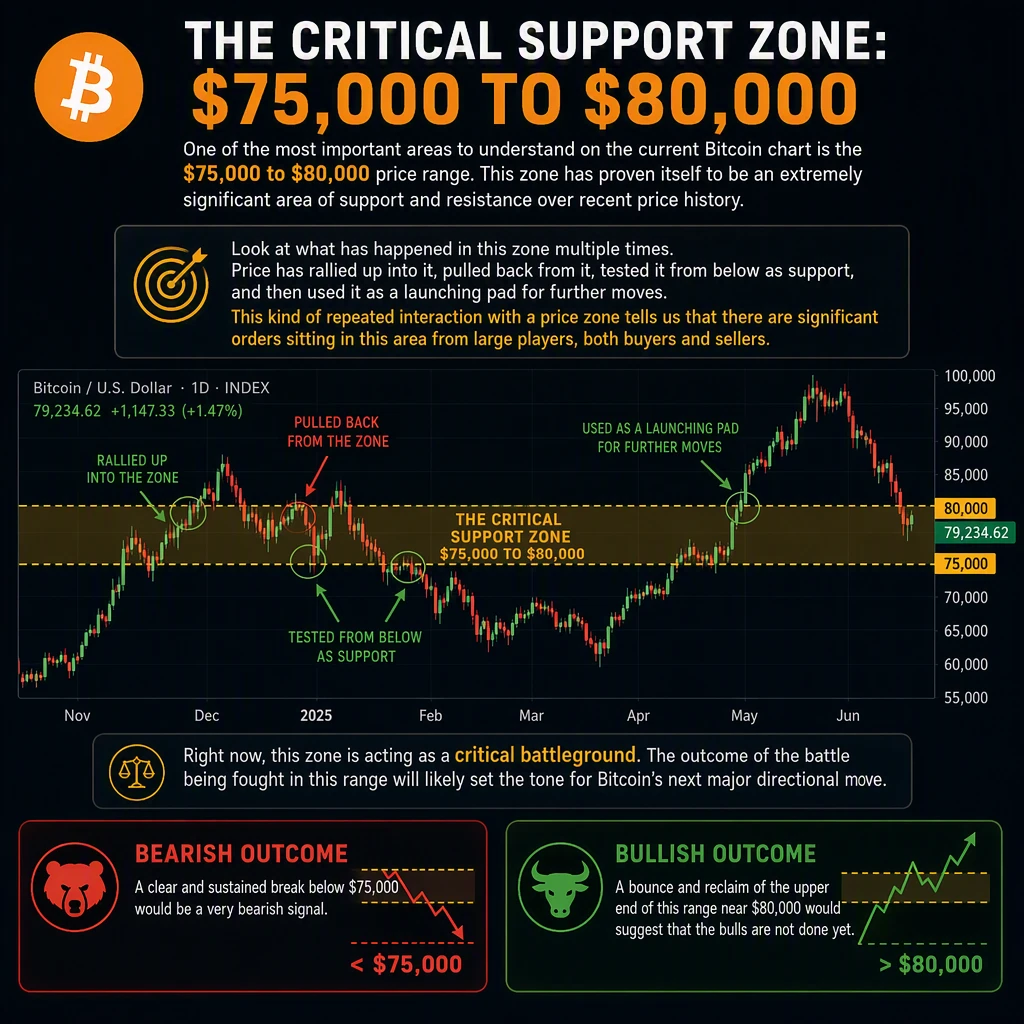
One of the most important areas to understand on the current Bitcoin chart is the $75,000 to $80,000 price range. This zone has proven itself to be an extremely significant area of support and resistance over recent price history.
Look at what has happened in this zone multiple times. Price has rallied up into it, pulled back from it, tested it from below as support, and then used it as a launching pad for further moves. This kind of repeated interaction with a price zone tells us that there are significant orders sitting in this area from large players, both buyers and sellers.
Right now, this zone is acting as a critical battleground. The outcome of the battle being fought in this range will likely set the tone for Bitcoin’s next major directional move. A clear and sustained break below $75,000 would be a very bearish signal. A bounce and reclaim of the upper end of this range near $80,000 would suggest that the bulls are not done yet.
What Are The Indicators Saying?
Price action alone tells a compelling story, but when you add technical indicators into the mix, the picture becomes even clearer. Let us look at what three of the most reliable indicators are currently showing for Bitcoin.
Parabolic SAR: Bearish Signal Confirmed
The Parabolic SAR is one of the most straightforward trend following indicators available. When the dots are positioned above the price, it signals a downtrend. When they are positioned below the price, it signals an uptrend.
Right now, the Parabolic SAR dots are sitting at $91,400, which is significantly above the current Bitcoin price. This is a clear and unambiguous bearish signal. The Parabolic SAR is telling us that the trend is down, and until the price can rally above $91,400 and flip these dots to below the price, the bearish bias remains the dominant framework.
TD Sequential: Sell Exhaustion Signal Incoming
The TD Sequential is a powerful indicator used by professional traders to identify potential turning points in the market. It works by counting sequential price bars and generating signals when a trend has run its course and is likely to reverse or at least pause.
Currently, the TD Sequential has printed a down eight signal on Bitcoin. This means it is just one candle away from completing a full nine count sell exhaustion signal. When a nine count completes on the downside, it often indicates that selling pressure is becoming exhausted and that a short term bounce or reversal may be on the horizon.
This is an important signal to watch. If the nine count completes in the coming candles, it could indicate that while the overall trend is still bearish, a temporary relief rally might be due. Traders should factor this into their planning and be prepared for short term volatility.
MACD: Bearish Crossover Confirms Downward Momentum
The MACD or Moving Average Convergence Divergence is perhaps the most widely followed momentum indicator in all of technical analysis. When the MACD line crosses below the signal line, it generates a bearish crossover signal, indicating that downward momentum is accelerating.
The MACD has recently crossed to the downside on the Bitcoin chart. Combined with the bearish signals from the Parabolic SAR and the approaching TD Sequential nine count, this creates a convergence of bearish signals that significantly increases the probability of further downside in the near term.
When multiple independent indicators are all pointing in the same direction, traders refer to this as confluence, and it is one of the strongest signals you can have that a particular trade setup is high probability.
The Role of Institutional Players and Michael Saylor
No Bitcoin analysis would be complete without considering the role of institutional investors in the market. The reality of the modern Bitcoin market is that large institutional players have enormous influence over price movements, and understanding what they are likely doing is a crucial part of any analysis.
There is a strong case to be made that large institutions are actively wanting the Bitcoin price to pull back to lower levels right now. Why? Because it gives them an opportunity to accumulate more Bitcoin at cheaper prices before the next major move higher.
This is a game that institutions have played across all financial markets for decades. Push the price down, shake out weaker hands and retail traders who panic sell, accumulate at lower levels, and then drive the price back up to new highs. If this playbook is being followed in the Bitcoin market right now, the pullback to the $73,000 to $76,000 range could actually represent a significant buying opportunity for long term holders.
On the flip side, it is impossible to ignore the potential impact of Michael Saylor and MicroStrategy. Saylor has established himself as one of the most aggressive and consistent institutional buyers of Bitcoin, and his purchasing activity has historically created notable upward pressure on the price.
If Saylor and other institutional buyers decide to step in aggressively at current levels, it could completely change the short term picture and push Bitcoin back towards and potentially beyond the $81,000 resistance level. This is the key wildcard in the current setup and is one of the main reasons why having a clear stop loss strategy is so important.
Two Scenarios: Here Is What Could Happen Next
Based on everything we have looked at, here are the two most likely scenarios for Bitcoin in the near term:
Scenario One: The Bearish Case
Bitcoin breaks below $76,157, confirming the bearish structure. The price then moves down towards the first target of $73,402, potentially followed by a deeper move to $71,983. At these lower levels, buying interest begins to emerge, and the market starts to stabilize. This is followed by a period of sideways consolidation before Bitcoin eventually begins to recover and work its way back upward.
This scenario would be consistent with the bearish signals from the Parabolic SAR, MACD, and the broader lower high structure on the chart.
Scenario Two: The Bullish Reversal
Bitcoin manages to hold the $75,000 to $76,000 support zone and rejects the downside move. Institutional buying, possibly led by players like Michael Saylor, provides a floor for the price. Bitcoin then rallies back above $81,000, breaks out to new highs, and resumes its longer term uptrend.
In this scenario, the short trade setup becomes invalidated, and the focus shifts entirely to identifying long opportunities with upside targets well above the current price.
Key Levels At A Glance
Here is a quick reference summary of all the critical Bitcoin price levels discussed in this analysis:
| Level | Significance |
|---|---|
| $91,400 | Parabolic SAR Resistance |
| $81,000 | Key Resistance / Bullish Breakout Level |
| $76,200 | Short Entry Trigger Zone |
| 75,000−80,000 | Critical Support and Resistance Zone |
| $73,402 | First Take Profit Target |
| $71,983 | Second Take Profit Target |
Final Thoughts: Be Prepared, Be Disciplined
The Bitcoin market is at a genuinely fascinating and critical juncture right now. The technical picture is leaning bearish in the short term, with multiple indicators converging to suggest further downside is likely. But the market always has the ability to surprise, and the presence of strong institutional buyers means that any bearish move could be short lived.
The most important things you can take away from this analysis are:
– Respect the key levels. The $75,000 to $80,000 zone is crucial and will tell you a lot about where Bitcoin is headed next.
– Always use a stop loss. No exceptions, no matter how confident you feel about a trade.
– Move your stop to breakeven once your first take profit is hit.
– Watch the indicators. The Parabolic SAR, TD Sequential, and MACD are all providing valuable information right now.
– Stay flexible. If Bitcoin breaks above $81,000, be willing to completely change your trading strategy.
Above all else, make sure you are doing your own research and not relying solely on any single analysis or analyst. Look at the levels discussed here, pull them up on TradingView, do your own analysis, and make decisions based on your own risk tolerance and trading plan.
⚠️ Disclaimer: This article is intended for educational and informational purposes only and does not constitute financial advice of any kind. Cryptocurrency trading carries a substantial risk of loss and is not suitable for all investors. Always conduct your own research and consult with a qualified financial professional before making any investment or trading decisions. Never trade with money you cannot afford to lose.
What do you think about the current Bitcoin setup? Are you bullish or bearish on BTC in the short term? Leave your thoughts in the comments below and make sure you are subscribed to Crypto Cobra for the latest Bitcoin analysis and trade setups delivered straight to you.*