
By mid-2026, the cryptocurrency market was a multi‑trillion‑dollar asset class dominated by Bitcoin and Ethereum, with stablecoins and tokenized assets providing the transactional and infrastructure backbone.
Global crypto market capitalization hovers around the low‑to‑mid trillion range, with Bitcoin alone over 1.5 trillion USD in market value and accounting for close to 60% of total market cap. Retail trading and on‑chain activity have cooled from the 2025 peak, but institutional adoption, stablecoin usage, and real‑world asset (RWA) tokenization continue to grow, reshaping where value and volume accrue in the ecosystem.
Global Market Capitalization and Dominance
Total Market Capitalization
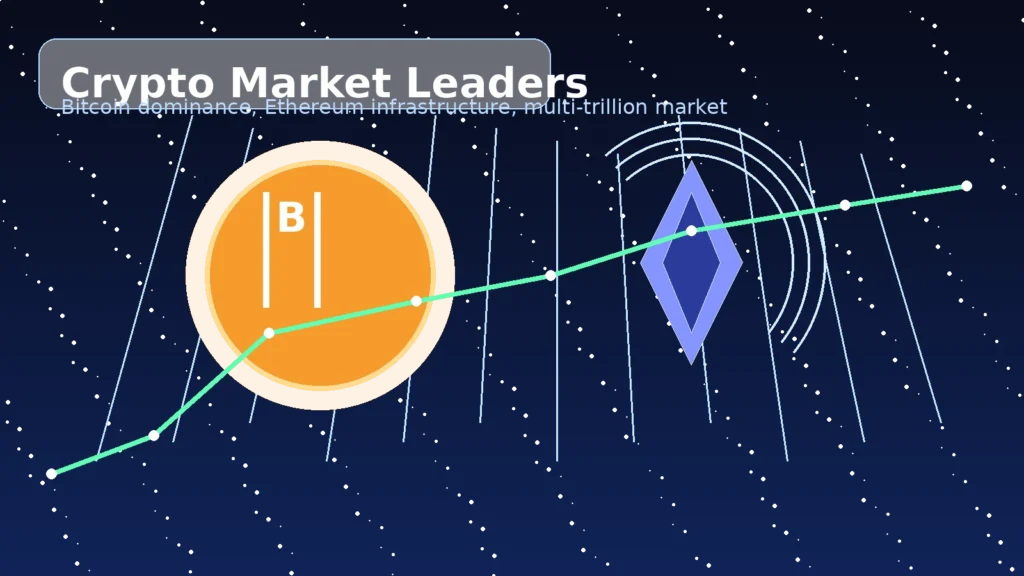
Aggregators such as CoinGecko and CryptoRank report a total cryptocurrency market capitalization in the ballpark of 2.6–2.7 trillion USD in early to mid‑2026, after a drawdown from the 4.4 trillion peak briefly reached in 2025. For example, CoinGecko lists the global crypto market cap at roughly 2.67 trillion USD, with a one‑year decline of about 25%, illustrating the post‑peak consolidation phase. This level still reflects substantial growth compared with pre‑2020 cycles, underscoring that crypto has structurally moved into the multi‑trillion‑dollar asset class bracket
Table of Contents
Bitcoin Market Cap and Dominance
Bitcoin remains the anchor asset, with a market capitalization of around 1.5 trillion USD as of late May 2026, down from more than 2.1 trillion USD a year earlier. YCharts data show Bitcoin’s market cap at approximately 1.521 trillion USD on May 23, 2026, almost 30% lower year‑on‑year, consistent with price normalization from the 2025 highs above 120,000 USD per BTC. Various dominance trackers put Bitcoin’s share of total market cap around 58–60% in 2026, confirming that BTC has re‑asserted itself as the primary store‑of‑value and macro proxy in crypto markets.
Ethereum and Other Majors
Ethereum retains a high‑single‑digit to low‑double‑digit percentage of overall crypto market capitalization, with data points around 9–10% ETH dominance next to Bitcoin’s ~58%. This dominance is supported by Ethereum’s central role in DeFi, NFTs, and RWA tokenization, even though its price and total value locked (TVL) in DeFi have fallen from late‑2025 peaks. Together, Bitcoin and Ethereum still account for a clear majority of total market value, with the remainder distributed across stablecoins, exchange tokens, L1/L2 platforms, DeFi tokens, and niche sectors.
Stablecoin Supply, Share, and Usage
Stablecoin Market Capitalization and Share
Stablecoins have become a structural pillar of the market, with total stablecoin capitalization above 300 billion USD, a new all‑time high by early 2026. Reporting from Phemex notes that the stablecoin market reached about 310.4 billion USD in early 2026, driven by strong inflows into Tether (around 186.6 billion USD) and USDC (roughly 76.6 billion USD). Several analyses put stablecoins at roughly 10–12% of total crypto market cap, with TechGaged‑referenced data citing a record stablecoin market share of 10.19% in early 2026.
Stablecoin Transaction Volumes
On a flow basis, stablecoins are even more dominant: 2025 data compiled in a Forbes analysis show stablecoins settling approximately 33 trillion USD in transactions over the year, more than Visa and Mastercard combined. Transaction volumes grew about 105% year‑on‑year in 2025 while supply grew only 48%, indicating a rising velocity of stablecoin turnover rather than simple accumulation. USDT alone processed an estimated 19.1 trillion USD and more than 6.7 billion transactions, capturing roughly three‑quarters of stablecoin retail market share.
Regulatory Focus on Stablecoins
Regulators increasingly focus on stablecoins as systemically important payment instruments, and the 2026 edition of PwC’s Global Crypto Regulation Report highlights stablecoins as a central theme across more than 50 jurisdictions. In the European Union, implementation of the Markets in Crypto‑Assets Regulation (MiCA) introduces detailed rules for asset‑referenced and e‑money tokens, covering reserves, redemption rights, and governance. In the United States, policy discussions revolve around payment stablecoins and federal guardrails, signaling integration of stablecoins into mainstream financial oversight rather than outright restriction.
Trading Volumes and Retail Activity
Spot Trading and Market Liquidity
Market‑wide spot trading volumes have normalized from the most euphoric phases but still sit in the tens of billions of USD per day across major centralized exchanges. Typical daily spot volume figures cited in market summaries and dashboards range around 100 billion USD on more active days, with short‑term spikes associated with macro news, regulatory events, or large BTC price moves. Liquidity is increasingly concentrated on a smaller set of compliant exchanges, while long‑tail venues see thinner order books and reduced retail flow.
Retail Volume and Global Adoption Index
TRM Labs’ Q1 2026 Global Crypto Adoption Index reports that global retail crypto volume reached 979 billion USD in Q1 2026, representing an 11% year‑on‑year decline and the second consecutive quarter of contraction. The same analysis highlights that the United States remains the largest retail market with more than 200 billion USD in quarterly volume, while countries such as Turkey and India display relative resilience or growth despite the broader slowdown. This pattern suggests that retail participation is becoming more regionally driven, tied to local macro conditions, currency instability, and regulatory posture rather than a single global risk‑on cycle.
Number of Crypto Users and Payments Adoption
Estimates of global crypto users vary, but multiple industry surveys suggest a user base in the mid‑hundreds of millions as of 2025, growing toward 800–900 million potential users by mid‑2026 under optimistic scenarios. One crypto payments analysis notes around 630–650 million active crypto users in 2025, with projections that the global user base could approach 800 million by 2026. Crypto payments volume is forecast to surpass 3 trillion USD by 2026, with stablecoins expected to account for nearly 60% of all payment activity due to their low volatility and integration with merchant gateways.[25]
DeFi: Total Value Locked and Structural Shift
DeFi TVL Levels and Dynamics
DeFi’s total value locked experienced a strong rebound into late 2025, with TVL peaking in the 170–230 billion USD range depending on measurement methodology, before undergoing a sharp contraction into 2026. A Crypto Briefing analysis reports that global DeFi TVL declined about 49% from its October 2025 peak to around 38 billion USD by May 2026, dropping even below the post‑FTX trough. This drawdown reflects both token price declines and outflows from risk‑on yield strategies as investors reassess smart‑contract risk, governance attacks, and the sustainability of incentive programs.
Ethereum’s DeFi Share and Competition
Ethereum remains the leading DeFi chain but with a declining share of total TVL compared with early 2025. The same analysis indicates that Ethereum’s share of DeFi TVL has fallen from about 63.5% in early 2025 to roughly 54% by May 2026, even as it still supports more than 45 billion USD in locked value. Competing ecosystems on other L1s and L2s have carved out niches in specific verticals such as liquid staking, perpetual DEXs, and high‑throughput gaming‑related protocols, further fragmenting liquidity.
Institutional DeFi and RWA Tokenization
Real‑world asset tokenization stands out as one of the fastest‑growing segments of DeFi‑adjacent activity, with Binance Research and other industry studies estimating tokenized RWA market size at around 23 billion USD in the first half of 2025. Subsequent reports point to RWA tokenization exceeding 26 billion USD on‑chain by early 2026, driven by categories such as tokenized U.S. Treasuries, private credit, and institutional‑grade products like BlackRock’s and Securitize’s tokenized funds. These products appeal primarily to institutions seeking better settlement speed, fractionalization, and programmable collateral, rather than to traditional yield‑farming retail users.
NFTs: From Bubble to Infrastructure
NFT Trading Volumes and Market Structure
The NFT market in 2026 is significantly smaller than at its 2022 peak but structurally healthier, with volume and activity concentrated in segments that offer genuine utility or cultural value. Analyses of the Ethereum NFT ecosystem suggest monthly trading volume around 720 million USD in early 2026, up from a 480 million USD trough in 2024 but still roughly 79% below the 3.5 billion USD monthly peak of 2022. Broader cross‑chain estimates place total NFT market volume around 2.8 billion USD per month in Q1 2026, representing a 140% rebound from the 2023 lows yet a fraction of the speculative mania levels.
Active Wallets and Survivorship
Active NFT wallets are estimated at about 505,000 on a 30‑day basis in early 2026, around 42% of the 2022 high, indicating that a core user base remains engaged even as many speculative participants have left. At the same time, about 94% of NFT collections launched in 2021–2022 now have zero secondary market volume, reflecting a brutal survivorship dynamic where value accrues to a small number of blue‑chip collections, gaming assets, and institutionally backed digital art. Gaming accounts for roughly 38% of NFT volume, with other major verticals including tokenized real estate, luxury fashion, and identity credentials.
Regulatory and Tax Implications
European regulations such as MiCA and the DAC8 tax transparency rules have materially reshaped NFT markets, increasing compliance costs but also providing clearer legal treatment for digital assets and tokenized collectibles. These frameworks push marketplaces and issuers toward stricter KYC/AML and reporting obligations, bringing NFTs closer to regulated financial or digital goods markets depending on their characteristics. For builders, this creates higher entry barriers but also a more predictable environment for long‑term projects and institutional participation.
Institutional Adoption and Market Structure
Institutional Sentiment and Allocations
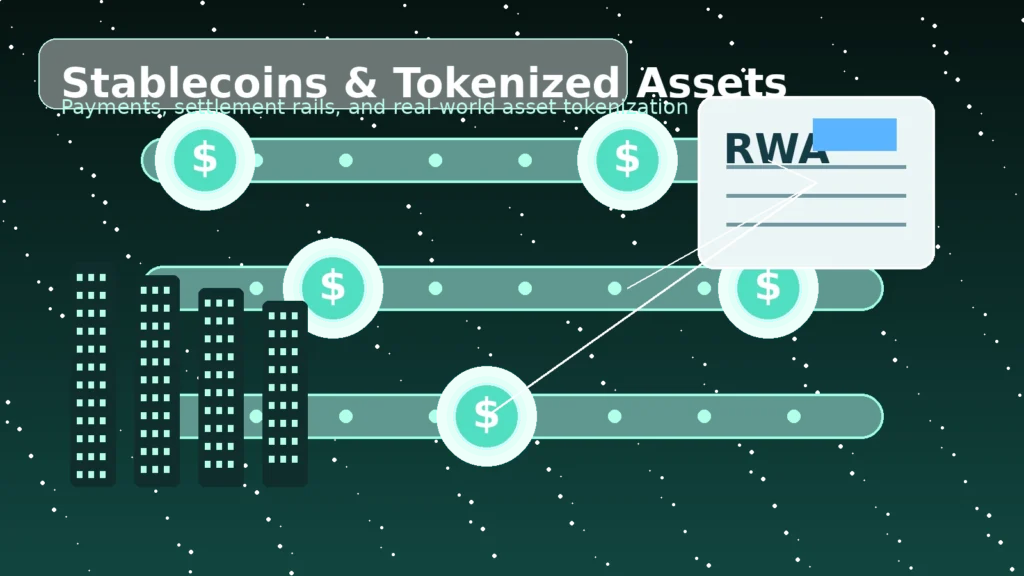
Institutional surveys and platform data from 2024–2025 already showed that a majority of institutions either held or planned to hold digital assets via funds or registered products. EY‑Parthenon and Coinbase research cited by Vaultody reports that 67% of institutions surveyed had invested in digital assets or related funds, and over 75% planned to increase allocations in 2025, with many targeting more than 5% of AUM in digital assets. Additionally, 94% of institutional respondents reportedly believed in the long‑term value of blockchain and digital assets, framing crypto as a structural rather than cyclical opportunity.
Impact of Spot Bitcoin ETFs
The launch and growth of spot Bitcoin ETFs, starting in 2024 and scaling through 2025, have been a major driver of institutional capital inflows. By 2025, total U.S. spot Bitcoin ETF assets were estimated at over 100 billion USD, giving traditional allocators a familiar wrapper for Bitcoin exposure within standard compliance and reporting frameworks. These ETFs helped push total crypto market cap to the brief 4.4 trillion USD high in 2025 before the subsequent correction, and they remain a key conduit for institutional BTC exposure in 2026.
Custody, Infrastructure, and Non‑Custodial Demand
As institutions scale crypto exposure, operational infrastructure rather than asset access becomes the bottleneck, driving demand for institutional‑grade custody, wallet governance, and compliance tools. Vaultody’s analysis emphasizes growing demand for both custodial and non‑custodial models, with non‑custodial wallets gaining traction among institutions that want direct control and reduced counterparty risk, particularly for tokenized treasuries and stablecoin settlement. Regulatory reports, such as PwC’s 2026 crypto regulation overview, echo this theme, stressing that winners will be those who build “compliance by design” into smart contracts, custody, and key management.
Regulatory Landscape in 2026
MiCA Implementation in the EU
The EU’s MiCA framework became fully effective at the end of 2024, with a grandfathering period for existing service providers that runs until as late as July 1, 2026, depending on the member state. MiCA establishes harmonized rules for issuance, trading, and custody of crypto‑assets not already covered by existing EU financial regulations, including many utility tokens and stablecoins. By 2026, attention has shifted from drafting the rules to supervision and enforcement, with European authorities focusing on reserve quality, redemption at par, and governance, especially for “significant” tokens.
Global Regulatory Themes
Globally, regulators are converging on several themes: stronger prudential standards for banks and institutions holding crypto, clearer disclosure and consumer protection rules for exchanges and brokers, and tighter financial‑crime controls for VASPs. The PwC 2026 report notes that many jurisdictions are refining stablecoin frameworks, cross‑border supervisory cooperation, and expectations around DeFi protocol transparency and smart‑contract auditability. These shifts increase compliance costs but also reduce legal uncertainty, which historically has been a major barrier to large‑scale institutional adoption.
Key Narrative Sectors in 2026
Real‑World Asset (RWA) Tokenization
RWA tokenization is one of the clearest growth narratives, with estimates of tokenized Treasury and private credit instruments surpassing 20–25 billion USD on‑chain by 2025 and continuing to grow in 2026. Products such as tokenized money‑market funds and on‑chain Treasuries increasingly serve as base collateral for DeFi protocols and as settlement instruments for institutions. Consultants such as McKinsey and BCG project multi‑trillion‑dollar tokenization markets by 2030, suggesting that the 2025–2026 figures represent an early phase of a much larger trend.
Stablecoin‑Based Payments and FX
The explosion in stablecoin settlement volumes and merchant acceptance positions stablecoins as a parallel cross‑border payment and FX infrastructure, especially in emerging markets. Crypto payments analyses report that global crypto transaction volumes increased more than 120% over three years to nearly 2.2 trillion USD in 2025, with a forecast that crypto‑based payments could exceed 3 trillion USD in 2026 and stablecoins take close to 60% share. TRM Labs’ adoption index further shows that in countries facing capital controls or currency instability, stablecoins already function as primary settlement rails for retail users.
NFTs, Gaming, and Digital Objects
In the NFT vertical, attention has shifted from speculative PFP cycles to gaming assets, digital collectibles tied to real‑world brands, and identity‑related credentials. Reports for 2026 highlight a “K‑shaped” recovery, where a handful of premium collections and gaming ecosystems capture the bulk of volume while most legacy projects have illiquid or worthless tokens. This reallocation of value aligns with a broader market move from hype‑driven narratives to infrastructure and long‑term utility.
Macro Drivers and Outlook for the Remainder of 2026
Macro and Policy Backdrop
The 2025–2026 crypto cycle has been heavily influenced by global macro conditions, including interest‑rate paths, dollar strength, and geopolitical tensions, which collectively pressured risk assets and reduced retail risk appetite. At the same time, a more crypto‑friendly U.S. administration and legislative progress (such as the GENIUS Act and pending Clarity Act) supported a structural shift toward regulatory clarity and institutional participation. The combination of less speculative retail activity and more regulated institutional infrastructure points toward a maturing asset class rather than a simple boom‑bust pattern.
Adoption Trajectory and Risks
On the adoption side, user counts, payment volumes, and tokenization metrics suggest that underlying blockchain usage continues to rise, even as speculative trading volumes fluctuate. Key risks for the remainder of 2026 include regulatory surprises, smart‑contract exploits, large‑scale liquidations in over‑levered derivatives markets, and macro shocks that could further compress valuations or delay the next expansion phase. Conversely, catalysts for renewed upside include deeper integration of tokenized assets into traditional finance, further ETF approvals or expansions, and continued migration of payment flows onto stablecoin rails.
Implications for Builders, Traders, and Content Creators
For builders and protocol teams, 2026 data indicate that sustainable traction is now more tightly linked to real usage (TVL quality, active addresses, transaction counts) and regulatory resilience than to token incentives alone. For traders and allocators, the shift toward dominance by BTC, ETH, stablecoins, and RWAs suggests a barbell market structure: one end in liquid, institutionally supported assets, the other in high‑risk, narrative‑driven altcoins with thinner liquidity. For content creators and educators, there is growing demand for explainers on stablecoin mechanics, tokenization, MiCA and other regulatory regimes, and the practical use of crypto in payments and financial infrastructure rather than purely speculative trading.