
Quick Summary: Bitcoin’s 2026 price depends on five forces: Fed policy, spot ETF flows, dollar liquidity and supply, sentiment, and regulation, with institutional ETF flows now carrying more weight than retail buying. The main risks are inflation or rate shocks, crowded leverage triggering liquidations, and regulatory surprises, as seen when Bitcoin fell from a record $126,198 to about $58,000 before rebounding near $84,000. Crypto Cobra recommends checking these signals monthly, sizing positions for another major drop, and acting only when several signals change together.
Bitcoin swung roughly $26,000 in a few months, from a 21-month low near $58,000 in late June 2026 to around $84,000 by late September. That whiplash is why this bitcoin market analysis focuses on drivers, not price guesses. We break down macro forces, ETF flows, supply, sentiment and regulation, then flag the main risks. Read it as a checklist for judging what moves prices next.

Where Bitcoin Stands in Late 2026
Bitcoin’s all-time high sits at $126,198, set in October 2025. In late 2026 it trades near $86,000, about 32% below that peak, after a 21-month low near $58,000 in June and a sharp rebound through September.
The 2026 Price Path So Far
The year split into two acts. Bitcoin slid from record levels to roughly $58,000 by late June, then climbed to around $84,000 by late September. Some analysts, including Bernstein, still see a run back toward $125,000 by December.

What the Sentiment Data Says
Fear and Greed readings have hovered near neutral, a sign traders expect chop rather than a clean trend. Our Bitcoin analysis coverage tracks these shifts daily, because sentiment often turns before price does. Watch liquidations and open interest alongside mood for the clearer signal.
The Main Forces Moving Bitcoin in 2026
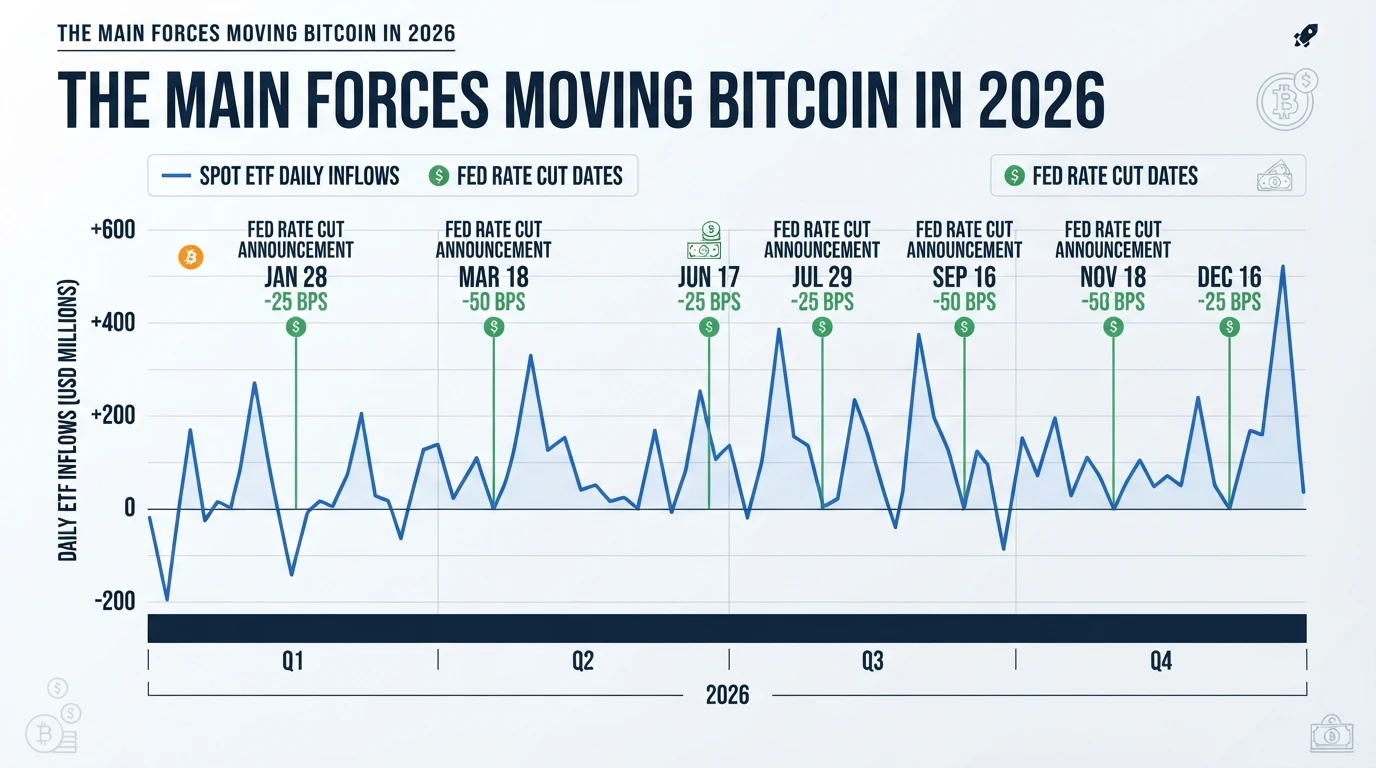
Bitcoin market analysis in 2026 comes down to five drivers: Fed policy, ETF flows, liquidity and supply, sentiment, and regulation. Three shape the price most right now.
Fed Policy and Rate Expectations
Federal Reserve interest rates set the tone. Rate cuts lift risk appetite, while sticky PCE inflation keeps officials cautious. Watch each FOMC meeting for hints on the federal funds target range, because a single dovish signal can push Bitcoin up within hours.
ETF Flows and Institutional Demand
Spot Bitcoin ETF net inflows and outflows now move price more than retail buying. When funds add, exchanges see steady demand; when they dump, liquidations follow. Track daily flow data and rising open interest to confirm a trend before trading it.
Liquidity, Supply Schedule and Halving Math
Global dollar liquidity gives Bitcoin its fuel. On the supply side, halving math stays simple: miners release only about 450 new coins daily, so demand shifts decide the price. Each halving cuts that issuance, tightening supply until the next event in 2028.
The Key Risks to Watch
The three biggest Bitcoin risks in 2026: an inflation or rate shock, crowded leveraged positions, and shifting regulation. Each can flip the market fast, as June’s slide toward $58,000 proved.
Macro and Inflation Shock Risk
Hot PCE inflation or a Fed pause on rate cuts can drain risk appetite. When real yields rise, capital leaves crypto first. A single hawkish FOMC meeting can erase weeks of gains.

Leverage, Liquidations and ETF Mechanics
Heavy open interest means crowded trades. One sharp move can trigger cascading liquidations that deepen the drop. Watch spot Bitcoin ETF outflows too: sustained redemptions signal institutions stepping back.
Regulatory and Policy Uncertainty
The US Clarity Act and the UK’s FCA crypto framework could clarify rules, but enforcement actions and tax changes still surprise. Crypto regulation 2026 headlines alone can move price 10% in a day.
How to Turn This Analysis into a Plan
A Simple Signal Checklist to Monitor
Which Bitcoin indicators should you check each month? Watch these five:
- ETF flows: net inflows show institutions buying, outflows show them selling
- Fed decisions: FOMC rate moves and PCE inflation
- Regulation: crypto regulation 2026 headlines, like the Clarity Act
- Supply: the steady 450 coins mined daily
- Sentiment: Fear and Greed Index plus liquidation spikes
Crypto Cobra’s market outlook tracks the same signals, so you can compare your read against a written baseline.
Sizing, Reviewing and Staying Neutral
Size positions so one $58,000-style slide cannot knock you out. Set a review date each month, score each signal green or red, and adjust only when several flip together. That keeps emotion out of the decision.

Tracking Bitcoin through 2026’s swings takes constant data and sharp analysis. Get both in one place with Crypto Cobra, and sign up free to act sooner.
Frequently Asked Questions
What are the main forces moving Bitcoin in 2026 and the risks to watch?
Fed rate decisions, spot Bitcoin ETF flows, dollar liquidity, supply, sentiment and regulation drive price. Watch inflation shocks, leverage cascades and regulatory surprises most closely.
How do ETF flows affect Bitcoin’s price?
They now outweigh retail buying. Net inflows add steady demand; sustained outflows often trigger liquidations and steeper drops.
What Bitcoin signals should I check monthly?
ETF flows, FOMC outcomes, PCE inflation, regulatory headlines, daily issuance and the Fear and Greed Index.
Conclusion
Bitcoin’s 2026 hinges on five drivers: Fed policy, ETF flows, liquidity and supply, sentiment, and regulation. Check the signals monthly, size positions for another drop toward $58,000, and act on several signals flipping together, not one.