Evidence from on-chain flows, remittance corridors, and currency-crises economies
Abstract stablecoin payments in emerging markets
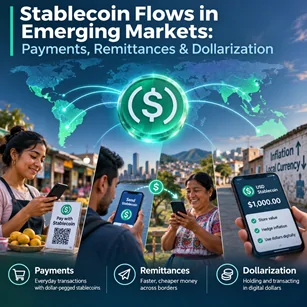
Stablecoins have become a major channel for moving dollar-denominated value across borders, but it remains unclear how much of their volume represents genuine payments rather than exchange trading, market-making, or speculative crypto activity. This paper examines stablecoin flows into and out of emerging markets, combining on-chain transfer data with remittance-cost, inflation, exchange-rate, capital-control, and regulatory data.
We distinguish payment-oriented transfers from exchange and bot activity using address labels, transaction-size distributions, counterparty patterns, and robustness checks. We then assess whether stablecoins function as a substitute for banks, money-transfer operators, mobile money, and domestic instant-payment systems in selected emerging markets. Case studies of Argentina, Nigeria, Turkey, and either the Philippines or Kenya provide institutional context for the econometric results. The paper contributes a transparent framework for measuring the payment share of stablecoin activity and evaluates the trade-offs between financial inclusion, remittance-cost reduction, currency substitution, and capital-flow management. 1 2 3
Table of Contents
Introduction
The puzzle: volume is not the same as payments
Stablecoin volumes are enormous, but raw transfer value is a poor proxy for real economic activity. Much on-chain volume reflects exchange deposits and withdrawals, arbitrage, liquidity provision, market-making, wallet consolidation, and automated bot transfers; treating every transfer as a “payment” would materially overstate stablecoins’ role in emerging-market commerce. 4 5
The paper should therefore begin with the distinction between gross on-chain volume, net cross-border flows, exchange-related flows, and final-user payment flows. BIS research finds that stablecoins accounted for close to half of cross-border crypto volume at its 2021 peak, but its analysis also distinguishes transactional motives from speculative and funding motives.
The paper should therefore begin with the distinction between gross on-chain volume, net cross-border flows, exchange-related flows, and final-user payment flows. BIS research finds that stablecoins accounted for close to half of cross-border crypto volume at its 2021 peak, but its analysis also distinguishes transactional motives from speculative and funding motives.bis
Suggested framing: “A billion dollars moving between two exchanges is not the same economic event as a $200 remittance reaching a household in Lagos or Buenos Aires.”
Get the Free Crypto Checklist
Sign up to get your free Crypto Cobra checklist.
Why emerging markets matter
Emerging markets are the natural setting for studying stablecoin payments because several frictions are unusually severe: high inflation, currency depreciation, foreign-exchange shortages, capital controls, costly remittances, and uneven access to formal financial services. The IMF notes that stablecoin use in cross-border payments and remittances is expanding, although it remains small relative to the overall global payments market.imf+1
World Bank data show that sending remittances still costs an average of 6.36 percent of the amount sent, across 367 country corridors; this creates a clear economic incentive to experiment with alternatives, including stablecoin-based rails. The BIS finds that higher traditional remittance costs are associated with larger cross-border stablecoin flows, especially in emerging-market and developing economies.bis+2
Research questions
- How large are stablecoin flows into and out of emerging markets? Measure gross and net flows by country, region, chain, stablecoin, and time; normalize by population, GDP, internet users, and banked adults.
- What share of observed activity is plausibly payment-related? Estimate the share attributable to retail-sized transfers, P2P patterns, remittance-like corridors, merchant payments, and non-exchange wallets, while explicitly reporting uncertainty.
- Which macro-financial conditions drive adoption? Test inflation, currency depreciation, official-versus-parallel exchange-rate spreads, capital controls, remittance costs, mobile penetration, and regulatory intensity.
- Do stablecoins complement or compete with existing rails? Compare settlement speed, fees, FX spreads, access requirements, reliability, reversibility, and consumer protection against banks, Western Union-type money-transfer operators, mobile money, and Pix-style instant-payment systems.
- What are the macro-financial and regulatory implications? Assess whether stablecoins facilitate dollarization, weaken monetary transmission, help users evade capital-flow measures, or improve access to dollars and cross-border payments. IMF work warns that stablecoins may make it easier to circumvent capital-flow management measures, potentially amplifying outflows and exchange-rate stress.imf+1
Contributions
The paper adds four things:
- A payment-versus-trading decomposition of stablecoin flows, rather than treating all on-chain volume as economic use.
- A country-panel empirical design linking flows to measurable frictions, including FX premiums, inflation, remittance costs, and capital controls.
- Case-study validation in Argentina, Nigeria, Turkey, and the Philippines or Kenya, connecting quantitative patterns to local institutions and regulation.
- A policy-relevant comparison with conventional remittance and payment systems, with explicit attention to cost, speed, access, and consumer protection.
Roadmap
Section 2 defines stablecoins, use cases, emerging-market criteria, on/off-ramps, and chains. Section 3 reviews remittances, dollarization, capital controls, mobile money, and crypto-adoption literature. Section 4 describes data and identification. Sections 5–7 present descriptive results, drivers, and case studies. Sections 8–10 compare traditional rails, discuss risks, and derive policy implications.
Background and key definitions
Stablecoin types
The paper should define four categories:
| Type | Mechanism | Examples | Main risk |
|---|---|---|---|
| Fiat-backed | Claims backed by cash, Treasury bills, or other reserves | USDT, USDC | Reserve quality, custody, redemption, issuer transparency |
| Crypto-collateralized | Crypto assets back the stablecoin, often overcollateralized | DAI | Collateral volatility, liquidation risk, governance risk |
| Algorithmic | Supply rules or seigniorage mechanisms attempt to maintain peg | TerraUSD | Death-spiral/depeg risk |
| Tokenized deposits / CBDC-adjacent instruments | Bank money or central-bank liabilities represented digitally | Emerging models | Different legal claim and regulatory treatment |
The TerraUSD collapse is essential background because it demonstrates that “stable” does not mean riskless. The USDC depeg during the March 2023 SVB episode is equally important: even a fiat-backed stablecoin can trade below par when reserve assets or banking counterparties come under stress.
Payment, trading, and store-of-value uses
Use three non-exclusive categories:
- Payments: remittances, payroll, supplier invoices, cross-border e-commerce, P2P transfers, and merchant settlement.
- Trading and market infrastructure: exchange funding, arbitrage, DeFi collateral, liquidity provision, and crypto purchases.
- Store of value: holding dollar exposure during inflation, depreciation, capital controls, or banking uncertainty.
The empirical challenge is that these categories overlap: a user may buy USDT as a store of value, transfer it across borders, and later cash out through a local exchange.
Defining emerging markets
Use a transparent, reproducible definition rather than an ad hoc list. Recommended approach:
- Primary classification: World Bank income groups and lending categories.
- Secondary classification: IMF Advanced Economies versus Emerging Market and Developing Economies lists.
- Exclusions: jurisdictions with negligible crypto activity, severe data restrictions, or insufficient exchange-rate/remittance data.
- Robustness: repeat estimates using alternative income thresholds and regional groupings.
On-ramps and off-ramps
The practical payment story depends on conversion points:
- Centralized exchanges: high liquidity, but often require KYC and may dominate volume.
- P2P marketplaces: important where banking access or formal exchange access is constrained, but harder to observe cleanly.
- Fintech wallets and stablecoin issuers’ local partners: increasingly relevant for remittances and business payouts.
- OTC desks and informal dealers: potentially important in high-premium environments, but poorly measured.
The paper should distinguish “stablecoin received on-chain” from “stablecoin converted into local currency.” A transfer is not a completed payment until the recipient can use the value locally.
Chains and why they matter
Chain choice affects fees, finality, censorship resistance, liquidity, and user demographics:
- Ethereum: deep liquidity and institutional use, but gas fees can be high for small payments.
- Tron: low-cost USDT transfers and major retail/remittance usage, especially in emerging markets.
- Solana: low fees and high throughput, relevant for consumer payments and fintech integrations.
- Layer 2s: potentially lower-cost Ethereum settlement, but bridge risk and fragmented liquidity.
- Other networks: include only where data quality and liquidity justify inclusion.
A payment analysis should not pool all chains without controlling for network-specific fee schedules, block times, and wallet ecosystems.
Literature review
Remittance costs
Use the World Bank’s Remittance Prices Worldwide database as the core source for corridor-level fees. The global average cost was 6.36 percent in the latest available benchmark cited by the World Bank, while the FSB reports that mobile-money-funded remittances cost 5.4 percent in 2024.remittanceprices.worldbank+1
The literature should distinguish:
- Explicit sender fees.
- FX spreads.
- Receiver-side fees.
- Cash-out fees.
- Time costs and documentation requirements.
- Effective all-in cost per $200 transfer, the standard World Bank benchmark.
BIS evidence finds that a one-percentage-point increase in remittance cost is associated with a decline of more than 10 percent in traditional remittances and an increase of about 1.5 percent in cross-border stablecoin flows.imf
Currency substitution and dollarization
Frame stablecoins as a potential new form of digital dollarization. Households and firms may hold dollar stablecoins to preserve purchasing power, conduct trade, or protect savings when local banking and FX systems are unreliable.
The IMF’s 2026 working paper finds that, across 188 countries, stablecoin activity rises by roughly 30 percent in the six months after capital-outflow restrictions and that holdings rise by roughly 75 percent within a year of currency crises. These findings support the hypothesis that stablecoins can extend dollarization beyond physical cash and foreign bank accounts.imf+1
Capital controls and parallel FX premiums
Capital controls create a wedge between the official exchange rate and the market-clearing rate. That wedge is a measurable incentive to acquire dollars through stablecoins, especially where official access is rationed or taxed.
Use:
- IMF AREAER for capital-flow restrictions.
- Central-bank FX regulations.
- Argentina’s official rate versus dólar blue.
- Nigeria’s official/parallel-market spread.
- Turkey’s inflation and lira depreciation series.
- Black-market premium databases where methodologically defensible.
The BIS study finds that capital-flow management measures appear to have little effect on crypto flows, which is an important counterpoint to the simple “controls cause stablecoin adoption” story.bis
Mobile money and fintech
Mobile money matters because it establishes that digital payments can scale in low-banking environments. However, mobile money is generally domestic-currency-based and nationally bounded, whereas stablecoins provide a dollar-denominated, cross-border instrument.
The comparison should avoid treating mobile money as a competitor in every setting. In Kenya, for example, M-Pesa may be the final domestic settlement layer, while stablecoins may be used for the international leg and then converted into mobile money or cash.
BIS, IMF, and FSB
Key institutional sources:
- BIS Working Paper 1265, DeFiying Gravity?: bilateral stablecoin flows across 184 countries, 2017–2024; finds stronger transactional links for stablecoins than native crypto assets and an association with high remittance costs.bis
- IMF Working Paper on international stablecoin flows, capital controls, and currency crises: country-level panel of estimated flows across 188 countries, 2018–2025; links restrictions and crises to higher stablecoin activity.imf+1
- IMF Global Financial Stability Report: describes stablecoin flows into emerging markets as expanding rapidly, with potential benefits for settlement efficiency and cross-border payments, alongside financial-stability risks.imf+1
- FSB cross-border payments progress report: provides benchmark cost and speed data for remittances and payment systems.fsb
Crypto-adoption reports
Chainalysis’s Geography of Cryptocurrency is useful for country rankings, retail-versus-institutional patterns, and regional narratives, but it should not be treated as a direct measure of payments. Its estimates rely on web-traffic and app-usage attribution, which can misassign activity when users employ VPNs, exchanges, or cross-border services.imf+1
Chainalysis finds that stablecoin growth is particularly strong in low-income and lower-middle-income countries in Sub-Saharan Africa and Latin America, and that Turkish retail users’ stablecoin reliance reflects inflation and store-of-value motives.chainalysis+1
Research gap
The central gap is that most adoption studies measure crypto exposure, while payment studies often rely on provider claims or anecdotal evidence. Few papers systematically separate:
- Exchange-to-exchange settlement.
- Institutional treasury movements.
- Bot and market-maker activity.
- P2P transfers.
- Small-value retail transfers.
- Remittance-corridor flows.
- Actual local-currency off-ramps.
That separation is the paper’s core contribution.
Data and methodology
On-chain data
Build a country-period panel from:
- Dune Analytics: SQL queries over Ethereum, Solana, and selected L2s.
- Flipside Crypto: cross-chain warehouse queries.
- Artemis: cross-chain metrics and stablecoin supply.
- Etherscan / Tronscan: address-level transfers and token-transfer events.
- Chainalysis or similar commercial data: only if licensing and methodology documentation permit.
- Stablecoin issuer disclosures: Circle and Tether attestations, reserve composition, and redemption disclosures.
Core variables:
- Gross stablecoin transfer value.
- Transfer count.
- Active sending and receiving addresses.
- Median and mean transfer size.
- Share of transfers below $1,000.
- Share of transfers between $1,000 and $10,000.
- Share above $100,000.
- Stablecoin composition: USDT, USDC, DAI, PYUSD, and others.
- Chain composition.
- Estimated net inflows and outflows.
Address clustering and labeling
Address labels are essential but imperfect. Use a hierarchy of confidence:
- High confidence: known exchange hot wallets, issuer treasury addresses, smart contracts, regulated custodians.
- Medium confidence: addresses repeatedly linked to a named service through public disclosures or clustering.
- Low confidence: unlabeled addresses inferred from behavioral patterns.
- Unknown: retained separately, never silently assigned to a category.
State plainly that entity attribution can be wrong, especially for P2P traders, OTC desks, self-custody users, and wallets that interact with multiple services.
Off-chain data
Use official and high-quality secondary sources:
- IMF International Financial Statistics: exchange rates, inflation, monetary aggregates.
- World Bank World Development Indicators: GDP, population, internet penetration, mobile subscriptions, bank-account ownership.
- World Bank Findex: account ownership, digital-payment use, remittance receipt.
- World Bank Remittance Prices Worldwide: corridor-level transfer costs.worldbank+1
- IMF AREAER: capital-flow restrictions.
- Central-bank publications: Nigeria, Argentina, Turkey, Philippines, Kenya.
- Parallel-market data: use carefully and document source, frequency, and construction.
- Regulatory timelines: manual coding from primary legal and central-bank sources.
Stablecoin supply and reserves
Use issuer attestations only as a supplement, not as proof of payment demand. Reserve disclosures can support analysis of issuance, redemption, and backing, but they do not identify who holds tokens or why.
For USDC and USDT, record:
- Circulating supply.
- Attested reserves.
- Reserve composition.
- Redemption terms.
- Attestation date and auditor.
- Any material changes during the sample.
Filtering approach
This is where the paper earns credibility.
- Remove internal exchange transfers. Exclude transfers between addresses labeled as belonging to the same exchange, unless they represent customer withdrawals or deposits.
- Remove likely bot activity. Flag high-frequency, round-number, repetitive, or programmatically patterned transfers.
- Use size bands. Do not impose one universal “payment” threshold. Use:
- Under $500: likely retail/P2P.
- $500–$10,000: mixed retail, SME, and professional activity.
- $10,000–$100,000: business, OTC, and institutional activity.
- Above $100,000: likely institutional, exchange, treasury, or market-making activity.
- Separate P2P from exchange flows. Identify transfers that do not touch a labeled exchange, issuer, custodian, or known DeFi contract.
- Identify remittance-like corridors. Use origin-destination pairs with large migrant stocks, recurring monthly patterns, and relatively small ticket sizes.
- Cross-validate with off-ramps. Where possible, compare on-chain inflows with local exchange volumes, fintech wallet activity, or central-bank payment statistics.
Empirical strategy
Baseline panel model
Estimate:
Flowi,t=β1FXPremiumi,t+β2Inflationi,t+β3Depreciationi,t+β4CapitalControlsi,t+β5RemittanceCosti,t+γXi,t+αi+λt+εi,t
Where:
- Flowi,t: log gross inflows, log net inflows, or payment-filtered flow.
- FXPremiumi,t: parallel-market premium where available.
- Inflationi,t: year-over-year CPI inflation.
- Depreciationi,t: local-currency depreciation against USD.
- CapitalControlsi,t: IMF AREAER-based index or event dummy.
- RemittanceCosti,t: corridor-level cost from World Bank RPW.
- Xi,t: population, GDP per capita, internet penetration, mobile penetration, banking access.
- αi: country fixed effects.
- λt: time fixed effects.
Run separate specifications for:
- Gross on-chain volume.
- Net cross-border inflows.
- Retail-sized transfers.
- P2P-filtered transfers.
- Remittance-corridor transfers.
- USDT-only and USDC-only flows.
- Tron-only, Ethereum-only, and Solana-only flows.
Event studies
Use high-frequency event windows around:
- Nigeria’s 2021 central-bank restriction on banks servicing crypto exchanges.
- Argentina’s capital-control tightening and later liberalization.
- Turkey’s lira crises and inflation shocks.
- Major stablecoin depegs.
- Local exchange outages or regulatory actions.
Measure abnormal stablecoin inflows, retail-sized transfer counts, and off-ramp activity before and after each event.
Difference-in-differences
Where credible treatment and control groups exist, estimate:
Yi,t=βTreatmenti×Postt+αi+λt+εi,t
Potential designs:
- Countries introducing stablecoin-specific licensing versus comparable countries that did not.
- Remittance corridors facing major fee changes.
- Jurisdictions tightening or relaxing FX controls.
- Countries with major exchange restrictions versus neighboring economies.
Be cautious: regulatory changes are rarely random, and treatment timing may coincide with broader macro shocks.
Robustness
At minimum:
- Alternative transaction-size thresholds.
- Alternative address-labeling rules.
- Excluding the largest exchanges.
- Excluding bot-like addresses.
- Alternative flow measures: gross, net, per capita, per internet user, per banked adult.
- Alternative stablecoin definitions.
- Alternative emerging-market classifications.
- Placebo tests using non-stablecoin crypto flows.
- Wild-cluster bootstrap or country-level clustered standard errors.
- Sensitivity to outliers and zero-flow countries.
Stylized facts and descriptive analysis
Aggregate flows
Present a time-series chart of stablecoin inflows and outflows by region:
- Latin America and the Caribbean.
- Sub-Saharan Africa.
- Middle East and North Africa.
- South Asia.
- East Asia and Pacific.
- Europe and Central Asia.
Separate charts for:
- Gross transfer value.
- Net flows.
- Transfer count.
- Active addresses.
- Retail-sized transfers.
- Exchange-filtered transfers.
The paper should avoid claiming that higher gross volume means higher payment adoption. Show both measures side by side.
Country rankings
Rank countries using several denominators:
| Measure | What it reveals | Limitation |
|---|---|---|
| Raw USD inflow | Market size and liquidity | Favors large economies and exchange hubs |
| Inflow per capita | Individual-level intensity | May reflect hubs, not residents |
| Inflow per GDP | Economic relevance | Distorted by financial centers |
| Inflow per banked adult | Access gap | Requires high-quality inclusion data |
| Inflow per internet user | Digital accessibility | Does not capture usage quality |
| Retail-sized share | Payment-like activity | Still imperfect due to labeling |
Stablecoin composition
Analyze USDT versus USDC by country and use case:
- USDT: often dominant in emerging-market trading, P2P, and dollar-access use cases.
- USDC: potentially more important in institutional settlement, regulated fintech products, and compliant payment corridors.
- DAI and decentralized stablecoins: examine separately; collateral and governance risks differ.
- Local-currency stablecoins: include where relevant, but distinguish them from USD stablecoins.
Chainalysis reports that stablecoins are gaining share in MENA, including Türkiye, where retail reliance appears tied to inflation and store-of-value concerns.chainalysis
Transaction-size distributions
Plot the full distribution, not only averages:
- Number of transfers by size bucket.
- Value share by size bucket.
- Median transfer size.
- Share of transfers under $1,000.
- Share of transfers under $10,000.
- Share above $100,000.
- Concentration ratio: share of value from the top 1 percent of addresses.
A high-value-dominated distribution suggests trading, treasury, or institutional settlement. A heavier small-ticket distribution is more consistent with retail payments, though it is not proof.
Seasonality
Test whether flows rise around:
- Month-end payroll and supplier-payment cycles.
- Religious holidays and migrant remittance peaks.
- Currency crises and devaluation episodes.
- Exchange outages.
- Regulatory announcements.
- Crypto-market volatility spikes.
Seasonality is useful evidence, but it cannot by itself establish causality.
Drivers of adoption
Inflation and depreciation
Hypothesis: higher inflation and expected depreciation increase demand for dollar-denominated stablecoins as a store of value and medium of exchange.
Measure:
- Year-over-year CPI inflation.
- Official exchange-rate depreciation.
- Real exchange-rate changes.
- Inflation expectations where available.
- Local-currency stablecoin premiums, where tradable.
Capital controls and FX premiums
Hypothesis: restrictions on foreign-currency access increase the value of stablecoins as a workaround.
Measure:
- Capital-control indices.
- Official FX rationing.
- Multiple exchange-rate regimes.
- Blue-dollar or parallel-market premium.
- Taxes on FX purchases.
- Restrictions on international card payments.
The IMF finds that stablecoin activity rises after capital-outflow restrictions, though the BIS finds limited average effect of capital-flow measures on crypto flows. This apparent tension should be discussed explicitly rather than hidden.bis+1
Remittance corridors
Hypothesis: high-cost remittance corridors create demand for stablecoin-based alternatives.
Use World Bank RPW corridor-level data and test whether stablecoin flows are larger where:
- Fees are high.
- Settlement is slow.
- Banking access is limited.
- Migrant stocks are large.
- FX spreads are wide.
The BIS result is directly relevant: higher remittance costs are associated with higher cross-border stablecoin flows.bis+1
Mobile and internet access
Hypothesis: smartphone access, internet penetration, and digital-payment familiarity lower the cost of using stablecoins.
But do not assume access equals adoption. A country can have high mobile penetration but low stablecoin use because of regulation, low dollar demand, or strong domestic payment infrastructure.
Regulation
Code regulation along several dimensions:
- Exchange licensing.
- Stablecoin issuer licensing.
- Bank access to crypto firms.
- P2P restrictions.
- KYC/AML requirements.
- Tax reporting.
- FX-control treatment.
- Restrictions on crypto payments.
- Enforcement intensity.
Distinguish restrictive regulation from permissive but supervised regulation. A licensing regime may reduce anonymous usage while increasing institutional adoption.
Correlation versus causation
The key identification problem is that inflation, depreciation, controls, remittance costs, and crypto adoption all respond to macroeconomic stress. A country with high inflation may also have weak institutions, shallow FX markets, and greater demand for dollars.
Use:
- Country and time fixed effects.
- Lagged explanatory variables.
- Event-study designs.
- Difference-in-differences where feasible.
- Instrumental variables only with a credible exclusion restriction; otherwise avoid overclaiming causality.
- Placebo tests using Bitcoin or Ether flows.
- Placebo tests using stablecoin flows in advanced economies.
State the causal claim conservatively: the paper can establish conditional associations and event-time patterns, not definitive causal effects from observational data alone.
Case studies
Argentina
Background. Argentina combines chronic inflation, recurring balance-of-payments pressure, FX controls, and a long history of dollarization. It is therefore an ideal setting for testing whether stablecoins function as a digital dollar hedge and cross-border payment tool.
Timeline. Code major events: the cepo capital controls, multiple exchange-rate regimes, inflation spikes, changes to dollar-purchase limits, and the 2025 easing of controls. The parallel dólar blue premium is a central treatment variable.
Data. Use on-chain USDT and USDC flows, local exchange data where accessible, central-bank FX data, inflation, and blue-dollar premium series. Chainalysis reports that Argentine users and businesses have turned to stablecoins amid currency devaluation and constrained access to dollars.chainalysis
Mechanisms. Stablecoins may allow users to obtain dollar exposure, settle cross-border invoices, receive freelance income, or move value without relying entirely on official FX channels. The key test is whether retail-sized, non-exchange flows rise with the FX premium.
What generalizes. Argentina likely generalizes to economies with high inflation, FX rationing, and credible dollar demand—but not necessarily to countries with stable currencies or deep local-currency payment systems.
Nigeria
Background. Nigeria has a large remittance market, recurring FX shortages, capital-control pressures, and a major crypto/P2P ecosystem. It is a strong test case for the interaction between capital controls, remittances, and stablecoin adoption.
Timeline. Include the 2021 Central Bank of Nigeria directive restricting banks from servicing crypto exchanges, subsequent enforcement and policy changes, naira devaluations, and FX-market reforms.
Data. Use Tron and Ethereum USDT flows, P2P indicators, remittance-cost data, official and parallel exchange rates, and central-bank FX statistics.
Mechanisms. Stablecoins may facilitate dollar access, P2P trade settlement, remittances, and preservation of value. The central empirical question is whether flows rise around restrictions and whether small-value flows resemble remittance patterns.
What generalizes. Nigeria is especially informative for economies with FX scarcity, active P2P markets, and high remittance reliance. It may not generalize to countries with freely convertible currencies.
Turkey
Background. Turkey offers high inflation, repeated lira depreciation, relatively developed crypto exchange infrastructure, and substantial retail crypto participation. Unlike Argentina or Nigeria, it is less defined by a single extreme FX-control regime.
Timeline. Include lira depreciation episodes, inflation surges, interest-rate policy changes, crypto regulation, and exchange-related enforcement actions.
Data. Use stablecoin inflows, retail transfer shares, inflation, exchange rates, and Chainalysis country-level adoption measures. Chainalysis specifically identifies Turkish retail stablecoin reliance as connected to volatility concerns and store-of-value demand.chainalysis
Mechanisms. The primary mechanism may be inflation hedging rather than capital-control evasion. Test whether stablecoin inflows respond more to inflation and depreciation than to capital controls.
What generalizes. Turkey is useful for isolating the store-of-value channel in a relatively financially developed emerging market.
Philippines or Kenya
Choose one based on data availability, but the Philippines is likely the stronger remittance-led case; Kenya is stronger for mobile-money integration.
Philippines. Focus on overseas Filipino workers, remittance corridors, fintech wallets, and stablecoin-based payout services. The research question is whether stablecoins reduce effective remittance costs or mainly serve as a wholesale settlement layer behind licensed providers.
Kenya. Focus on mobile-money interoperability, M-Pesa cash-in/cash-out, P2P trading, and the potential for stablecoins to serve cross-border commerce rather than domestic payments.
Cross-case synthesis. The cases should produce a typology:
| Economy | Primary driver | Likely dominant use | Main constraint |
|---|---|---|---|
| Argentina | Inflation, FX controls, dollar scarcity | Store of value, cross-border settlement | Off-ramp liquidity and regulation |
| Nigeria | FX scarcity, remittances, P2P liquidity | Dollar access, P2P trade, remittances | Regulatory uncertainty and fraud risk |
| Turkey | Inflation and depreciation | Store of value, trading, payments | Banking and exchange access |
| Philippines or Kenya | Remittances, mobile money, financial access | Cross-border remittances and payouts | Cash-out costs and KYC friction |
Comparison with traditional rails
Cost comparison
Build a standardized $200 remittance comparison using provider price sheets, dated precisely.
| Rail | Typical cost components | Settlement time | Access constraint |
|---|---|---|---|
| Bank wire | Wire fee, correspondent fees, FX spread | 1–5 business days | Bank account, documentation |
| Western Union-type MTO | Sender fee, FX margin, cash-out fee | Minutes to days | Agent network, ID |
| Mobile money | Send fee, cash-out fee, FX margin for cross-border | Minutes to days | Mobile account and agent network |
| Stablecoin rail | On-chain fee, on-ramp spread, off-ramp spread, possible P2P premium | Minutes to hours on-chain; off-ramp may take longer | Wallet, internet, exchange/P2P access |
The all-in cost must include the local-currency conversion spread. A stablecoin transfer with near-zero blockchain fees can still be expensive if the on-ramp or off-ramp charges a wide spread.
World Bank RPW provides the appropriate benchmark: its global average remittance cost is 6.36 percent, and it covers 367 corridors. The FSB reports that mobile-money-funded remittances cost 5.4 percent in 2024.remittanceprices.worldbank+1
Speed, access, and reliability
Stablecoins can settle on-chain within minutes, but end-to-end remittance speed depends on KYC, banking hours, local exchange liquidity, compliance review, and cash-out availability. Do not equate blockchain finality with money reaching a household.
Complement or substitute?
Stablecoins may complement traditional rails when they serve as a wholesale settlement layer behind a licensed remittance provider. They may substitute for banks or MTOs when users directly buy, transfer, and cash out stablecoins through P2P markets.
The paper should distinguish:
- Wholesale substitution: fintech uses stablecoins internally to settle cross-border value.
- Retail substitution: individuals directly hold and transfer stablecoins.
- Hybrid model: stablecoin leg plus local mobile-money or bank cash-out.
Risks and limitations
Depeg and issuer risk
Stablecoins can depeg due to reserve losses, banking-counterparty stress, redemption runs, smart-contract failure, or loss of confidence. TerraUSD illustrates the failure mode of algorithmic designs; USDC’s SVB-era depeg illustrates that even fiat-backed designs face operational and counterparty risk.
Off-ramp frictions
The biggest practical barrier is often not sending USDT; it is converting it into usable local currency. Limited liquidity, identity requirements, banking restrictions, fraud, and P2P counterparty risk can make the final mile costly.
Illicit finance and sanctions
Avoid broad claims that stablecoins are inherently illicit. Instead, assess:
- Sanctions evasion risk.
- Money-laundering typologies.
- Terror-financing concerns.
- Exchange compliance quality.
- Chain-analytics limitations.
- The difference between observed transfers and proven criminal activity.
Consumer protection
Key issues:
- Irreversible transfers.
- Wrong-address losses.
- Scams and fake P2P traders.
- Custodial wallet failures.
- Poor disclosure of fees and FX spreads.
- Limited recourse when funds are frozen or stolen.
Data limitations
State the following explicitly:
- Wallet labels are incomplete and sometimes wrong.
- Exchange attribution may misassign activity.
- On-chain volume includes non-payment activity.
- Net-flow estimates depend on attribution assumptions.
- P2P activity is underobserved.
- Country attribution is imperfect when users employ VPNs or foreign platforms.
- Issuer reserve attestations do not establish user demand.
- Survey data may suffer from recall and social-desirability bias.
Methodological limits
The paper should say: “We estimate plausible payment-related activity, not definitive payments.” No on-chain dataset can fully observe whether a transfer was a remittance, invoice settlement, speculative purchase, or internal exchange movement.
Policy implications
Central-bank responses
Discuss four responses:
- CBDCs: may improve domestic digital payments but do not automatically solve cross-border remittance frictions.
- Capital-flow management: may become less effective if value can move through stablecoins and P2P channels.
- Stablecoin regulation: reserve, redemption, disclosure, licensing, and AML/CFT rules.
- Payment-system modernization: faster domestic rails, FX-market reform, and lower remittance costs may reduce the underlying demand for stablecoins.
The IMF specifically warns that stablecoins may facilitate circumvention of capital-flow management measures and amplify outflows or exchange-rate stress.imf
Monetary sovereignty
The paper should distinguish between:
- Partial digital dollarization: households hold stablecoins alongside local currency.
- Broad currency substitution: stablecoins become a dominant unit of account and payment medium.
- Financial-stability risk: deposit flight, bank-funding pressure, and reduced monetary-policy transmission.
Opportunities
The strongest pro-stablecoin case is not speculation; it is cheaper, faster, and more accessible cross-border value transfer. The BIS evidence that remittance costs predict stablecoin flows supports this channel.bis+1
Recommendations
For regulators:
- Regulate the activity, not merely the token label.
- Require reserve, redemption, disclosure, and operational-resilience standards for issuers.
- Apply AML/CFT rules proportionately to exchanges, custodians, and on/off-ramps.
- Preserve access to low-value payments while monitoring large and suspicious flows.
- Improve official FX access where shortages drive parallel-market demand.
- Use granular data-sharing frameworks rather than blanket bans that may push activity onshore to offshore or P2P markets.
For international policy:
- Focus on cross-border interoperability, common data standards, and travel-rule implementation.
- Avoid assuming that domestic CBDCs alone solve dollar-demand problems.
- Measure payment use, not just transaction volume.
Regulatory benchmarks
Use these as comparative policy cases:
- EU MiCA: classifies fiat-referenced tokens as e-money tokens and requires authorization, reserve, disclosure, and redemption safeguards.eba.
- Hong Kong: introduced a licensing regime for fiat-referenced stablecoin issuers under the Stablecoins Ordinance, effective August 1, 2025.
- Brazil: has moved toward treating stablecoin-related operations within the FX and international-capital perimeter, with VASP authorization and reporting requirements.
Conclusion
The paper’s central conclusion should be carefully worded: stablecoins appear to be more than a speculative crypto asset, particularly where inflation, currency depreciation, FX constraints, and expensive remittances create demand for dollar-denominated value transfer. However, the evidence does not yet justify treating all stablecoin volume as payment activity.
The main unknown is the payment share. Future work should use user-level surveys, merchant acceptance data, fintech transaction data, cross-chain wallet linkage, and randomized or quasi-experimental evidence from remittance-product launches.
The most useful contribution is not to declare stablecoins either a financial-inclusion breakthrough or a monetary-sovereignty threat. It is to measure where they actually reduce frictions, for whom, at what cost, and under which institutional conditions.
Core source list
- Auer, R., U. Lewrick, and J. Paulick. 2025. “DeFiying Gravity? An Empirical Analysis of Cross-Border Bitcoin, Ether and Stablecoin Flows.” Bank for International Settlements Working Paper No. 1265, May 8, 2025.
https://www.bis.org/publications/working-paper-1265-defiying-gravity-empirical-analysis-cross-border-bitcoin-ether-and-stablecoin-flows
Use: Your central empirical benchmark. It analyzes bilateral Bitcoin, Ether, USDT, and USDC flows across 184 countries from 2017 to 2024, assigns exchange-level flows to countries using web-traffic and app-usage data, and finds that stablecoin flows are more strongly associated with transactional motives than Bitcoin or Ether flows. It also finds that higher remittance costs are associated with greater cross-border stablecoin flows. - International Monetary Fund. 2026. “International Stablecoin Flows, Capital Controls and Currency Crises.” IMF Working Paper, October 2, 2026.
https://www.imf.org/en/publications/wp/issues/2026/10/02/international-stablecoin-flows-capital-controls-and-currency-crises-579853
Use: Core source for the country-level panel design and the capital-control/currency-crisis channel. The paper constructs estimated international stablecoin flows for 188 countries, totaling $21.4 trillion, and finds that stablecoin activity rises after capital-outflow restrictions and currency crises. - International Monetary Fund. 2026. “Stablecoin Inflows and Spillovers to FX Markets.” IMF Working Paper WP/26/56, March 2026.
https://www.imf.org/-/media/files/publications/wp/2026/english/wpiea2026056-source-pdf.pdf
Use: Supports the argument that stablecoins are becoming a parallel financial ecosystem interacting with conventional FX markets. Its daily price-and-flow data cover January 2021 through November 2025. - International Monetary Fund. 2026. “Capital Flows to Emerging Markets: The Role of Global Nonbank Investors.” Global Financial Stability Report, Chapter 2, April 2026.
https://www.imf.org/-/media/files/publications/gfsr/2026/april/english/ch2.pdf
Use: Contextualizes stablecoin flows within broader emerging-market capital-flow dynamics. The chapter states that stablecoin flows into emerging markets are expanding rapidly and remain closely tied to crypto-market activity, while their use cases are broadening. - International Monetary Fund. 2026. “Stablecoins: Promise, Risks, and Policy Choices for Emerging Markets.” Speech by Dan Katz, August 7, 2026.
https://www.imf.org/en/news/articles/2026/08/07/sp080726-stablecoins-emerging-markets-dan-katz
Use: Policy framing. It highlights that stablecoins may make it easier to circumvent capital-flow management measures, potentially amplifying outflows and exchange-rate stress. - International Monetary Fund. 2026. “New Frontiers for Digital Finance.” IMF Annual Report 2026.
https://www.imf.org/annual-report/2026/in-focus/new-frontiers-for-digital-finance/
Use: High-level institutional evidence that stablecoin use in cross-border payments and remittances is expanding, although it remains small relative to the broader payments system. - Financial Stability Board. 2024. “Annual Progress Report on Meeting the Targets for Cross-border Payments.” October 21, 2024.
https://www.fsb.org/uploads/P211024-3.pdf
Use: Benchmark for traditional cross-border payment costs and speed. It reports that the cost of funding remittance transactions through mobile money increased to 5.4 percent in 2024.
Remittances and payment costs
- World Bank. 2025. “Remittance Prices Worldwide.”
https://remittanceprices.worldbank.org/
Use: Primary source for corridor-level remittance-cost data. The World Bank reports a global average cost of sending remittances of 6.36 percent of the amount sent. - World Bank. 2024. “Remittance Prices Worldwide, Issue 49, March 2024.”
https://documents1.worldbank.org/curated/en/099053025160028449/pdf/P179351-627082db-1078-448b-9b66-660ea3287ace.pdf
Use: Historical benchmark issue for constructing a panel of remittance costs by corridor and time. - World Bank. 2024. “Remittance Prices Worldwide Quarterly, Issue 50, June 2024.”
https://documents.worldbank.org/en/publication/documents-reports/documentdetail/099053025160028284
Use: Supplementary source for quarterly remittance-cost trends and methodology. - World Bank. 2024. “Remittances & Migration.” September 18, 2024.
https://www.worldbank.org/en/brief/2024/09/18/remittances-knomad
Use: Source for remittance flows, migrant stocks, and the Remittance Prices Worldwide database. - World Bank. Remittance Prices Worldwide Resources.
https://remittanceprices.worldbank.org/resources
Use: Access point for quarterly RPW releases, including Issue 54 from September 2025, Issue 53 from March 2025, and Issue 52 from December 2024. - Centre for Economic Policy Research. 2026. “Currency Risk Drives Remittance Fees as Much as Markups Do.” VoxEU Column, November 16, 2026.
https://cepr.org/voxeu/columns/currency-risk-drives-remittance-fees-as-much-as-markups-do
Use: Useful secondary interpretation of the BIS findings on remittance costs and stablecoin flows; cite as commentary rather than as primary evidence.
Financial inclusion and macro data
- Demirgüç-Kunt, A., L. Klapper, D. Singer, and S. Ansar. 2022. The Global Findex Database 2021: Financial Inclusion, Digital Payments, and Resilience in the Age of COVID-19. World Bank.
https://www.worldbank.org/en/publication/globalfindex/brief/the-global-findex-database-2021-chapter-3-financial-resilience
Use: Demand-side measures of account ownership, digital payments, mobile-money use, remittances, savings, and financial resilience.worldbank+1 - World Bank. 2023. “Global Findex Database.” World Bank DataBank.
https://databank.worldbank.org/source/global-findex-database
Use: Downloadable country-level indicators for financial inclusion and digital-payment adoption.documents1.worldbank - World Bank. 2023. “Global Financial Inclusion (Global Findex) Database 2021.” World Bank Microdata Library.
https://microdata.worldbank.org/index.php/catalog/4607
Use: Survey microdata and methodology. The 2021 round covers nearly 145,000 adults in 139 economies.databank.worldbank - World Bank. 2022. “The Global Findex Database 2021: Financial Inclusion, Digital Payments, and Resilience in the Age of COVID-19.” Open Knowledge Repository.
https://openknowledge.worldbank.org/entities/publication/b74e1909-3ecf-5009-b83c-8527fc4eefeb
Use: Full report and official citation. The database covers more than 140 economies and includes indicators on account ownership, digital payments, savings, borrowing, and financial resilience.imf+1 - International Monetary Fund. Various years. “Annual Report on Exchange Arrangements and Exchange Restrictions” (AREAER).
https://www.imf.org/en/publications/annual-report-on-exchange-arrangements-and-exchange-restrictions
Use: Primary source for coding capital controls, exchange arrangements, FX-market restrictions, and international-payment restrictions.imf+1 - International Monetary Fund. “AREAER Database User Guide.”
https://www.elibrary-areaer.imf.org/Pages/UserGuide.aspx
Use: Methodological guide for using the AREAER database and interpreting its capital-control categories.imf - International Monetary Fund. “International Financial Statistics” (IFS).
https://data.imf.org/
Use: Exchange rates, inflation, monetary aggregates, interest rates, and balance-of-payments data. Use the IMF’s official database portal and record the exact series codes and access dates in Appendix A. - World Bank. “World Development Indicators.”
https://databank.worldbank.org/source/world-development-indicators
Use: GDP, population, internet penetration, mobile-cellular subscriptions, bank-account ownership, and other country-level controls.
Crypto adoption and market data
- Chainalysis. 2024. “The 2024 Geography of Crypto Report.”
https://www.chainalysis.com/reports/2024-geography-of-cryptocurrency-report/
Use: Country and regional adoption patterns, stablecoin market share, retail versus institutional activity, and regional narratives. Treat it as descriptive evidence, not a direct measure of payment activity. - Chainalysis. 2024. “2024 Global Crypto Adoption Index.” September 11, 2024.
https://www.chainalysis.com/blog/2024-global-crypto-adoption-index/
Use: Country rankings and adoption-index methodology. - Chainalysis. 2024. “2024 Western Europe Crypto Adoption: Stablecoins Dominate.” October 23, 2024.
https://www.chainalysis.com/blog/2024-western-europe-crypto-adoption/
Use: Stablecoin market-share evidence and regional adoption trends. - Chainalysis. 2024. “Middle East & North Africa: Regulatory Momentum and DeFi Fuel Adoption.” September 25, 2024.
https://www.chainalysis.com/blog/middle-east-north-africa-crypto-adoption-2024/
Use: MENA adoption context, including Türkiye’s retail stablecoin reliance and inflation/store-of-value motives. - Dune Analytics.
https://dune.com/
Use: SQL-based on-chain analytics for Ethereum, Solana, Tron-related datasets where available, and selected Layer 2s. Use for token-transfer queries, wallet activity, stablecoin balances, and exchange-flow analysis. - Flipside Crypto.
https://flipsidecrypto.xyz/
Use: Cross-chain warehouse queries and reproducible blockchain analytics. Useful for constructing transfer-count, active-address, and value-flow panels. - Artemis.
https://www.artemisanalytics.com/
Use: Cross-chain metrics, stablecoin supply, bridge flows, and ecosystem-level activity. Useful for cross-checking aggregate supply and chain-level activity. - Etherscan.
https://etherscan.io/
Use: Ethereum address-level transfers, token-transfer events, contract interactions, and wallet labeling. - Tronscan.
https://tronscan.org/
Use: Tron-based USDT transfer data, address activity, and contract interactions. Particularly important because Tron is a major low-cost USDT settlement network in emerging markets. - Solscan.
https://solscan.io/
Use: Solana address and token-transfer data, especially for USDC, USDT, and Solana-native stablecoin activity. - DefiLlama.
https://defillama.com/
Use: Cross-chain stablecoin circulating supply, bridge flows, and protocol-level liquidity data. Use as a cross-check rather than as the primary payment-flow measure.
Stablecoin issuers and reserves
- Tether. “Transparency.”
https://tether.to/en/transparency
Use: USDT reserve attestations, reserve composition, issuance/redemption disclosures, and assurance reports. Cite the exact attestation date and auditor in every table. - Circle. “Transparency.”
https://www.circle.com/en/transparency
Use: USDC reserve composition, attestations, redemption terms, and issuer disclosures. Use to distinguish USDC’s institutional and regulated-market profile from USDT’s emerging-market and P2P profile. - Circle. 2023. “$3.3 Billion of USDC Reserve Risk Removed, Dollar De-Peg Closes.” March 13, 2023.
https://www.circle.com/pressroom/3-3-billion-of-usdc-reserve-risk-removed-dollar-de-peg-closes
Use: Primary source for the March 2023 USDC depeg. Circle stated that $3.3 billion of USDC reserves, about 8 percent of total reserves, had been held at Silicon Valley Bank; the depeg closed after regulators announced that depositors would be made whole.openknowledge.worldbank - Terraform Labs / Terra blockchain documentation and postmortem materials.
Use official Terra documentation, validator communications, and contemporaneous on-chain data for the May 2022 TerraUSD collapse.
Use: Case study for algorithmic-stablecoin failure and the distinction between fiat-backed and algorithmic designs. Do not rely on secondary crypto-media accounts for the central factual claims.
Country case studies
Argentina
- Banco Central de la República Argentina (BCRA). “Exchange Regulations” and “Statistics.”
https://www.bcra.gob.ar/
Use: Official FX regulations, exchange-rate data, capital-control measures, monetary statistics, and regulatory announcements. - Instituto Nacional de Estadística y Censos (INDEC), Argentina. “Consumer Price Index.”
https://www.indec.gob.ar/
Use: Official inflation series for Argentina. - Ámbito. “Dólar Blue.”
https://www.ambito.com/contenidos/dolar.html
Use: Widely used market-based source for the Argentine parallel “blue” dollar rate. Use only with a clearly documented methodology, timestamping, and cross-check against alternative market-data providers. - Chainalysis. 2024. “2024 Latin America Crypto Adoption: Argentina.”
Use the relevant Latin America chapter or country brief within the 2024 Geography of Crypto report.
Use: Context on Argentine stablecoin adoption, currency devaluation, dollar access constraints, and P2P activity.
Nigeria
- Central Bank of Nigeria. “Circulars,” “Press Releases,” and “Statistics.”
https://www.cbn.gov.ng/
Use: Primary source for the 2021 bank restriction on crypto exchanges, later policy changes, FX-market reforms, naira exchange rates, and monetary statistics. - National Bureau of Statistics, Nigeria. “Consumer Price Index.”
https://nigerianstat.gov.ng/
Use: Official inflation data. - Nigeria Exchange Group / official FX market sources.
Use Central Bank of Nigeria and Nigerian Exchange Group data for official FX rates; use credible market-data providers for parallel-market rates.
Use: Constructing official-versus-parallel FX spreads. - Chainalysis. 2024. “Sub-Saharan Africa: Nigeria.”
Use the relevant Sub-Saharan Africa chapter within the 2024 Geography of Crypto report.
Use: Country-level adoption context, P2P market activity, and stablecoin usage patterns.
Turkey
- Central Bank of the Republic of Türkiye (TCMB). “Statistics” and “Announcements.”
https://www.tcmb.gov.tr/
Use: Exchange rates, inflation expectations, policy rates, reserve data, and regulatory announcements. - Turkish Statistical Institute (TÜİK). “Consumer Price Index.”
https://data.tuik.gov.tr/
Use: Official inflation data. - Chainalysis. 2024. “Middle East & North Africa: Türkiye.”
https://www.chainalysis.com/blog/middle-east-north-africa-crypto-adoption-2024/
Use: Evidence that Turkish retail users rely on stablecoins amid volatility and store-of-value concerns.
Philippines
- Bangko Sentral ng Pilipinas (BSP). “Statistics” and “Regulations.”
https://www.bsp.gov.ph/
Use: Remittance statistics, payment-system regulation, virtual-asset service provider rules, and foreign-exchange data. - Philippine Statistics Authority. “Overseas Filipino Workers” and “Consumer Price Index.”
https://psa.gov.ph/
Use: Migration, remittance, and inflation data. - World Bank. “Philippines Country Data.”
https://data.worldbank.org/country/philippines
Use: GDP, population, mobile penetration, internet access, remittances, and financial-inclusion controls.
Kenya
- Central Bank of Kenya. “Payments Statistics” and “Regulation.”
https://www.centralbank.go.ke/
Use: Mobile-money statistics, payment-system oversight, foreign-exchange data, and crypto/VASP regulation. - Safaricom. “M-Pesa Reports” and “Investor Relations.”
https://www.safaricom.co.ke/
Use: M-Pesa user, transaction, and agent-network data; useful for assessing mobile-money penetration and cash-in/cash-out infrastructure. - Communications Authority of Kenya. “Sector Statistics Report.”
https://ca.go.ke/
Use: Mobile penetration, internet access, and digital-connectivity controls.
Regulation and policy
- European Union. “Markets in Crypto-Assets Regulation” (MiCA). European Securities and Markets Authority.
https://www.esma.europa.eu/esmas-activities/digital-finance-and-innovation/markets-crypto-assets-regulation-mica
Use: EU-level framework for crypto-assets, including asset-referenced tokens and e-money tokens. - European Banking Authority. “Asset-Referenced and E-Money Tokens (MiCA).”
https://www.eba.europa.eu/regulation-and-policy/asset-referenced-and-e-money-tokens-mica
Use: Explains MiCA’s authorization, reserve, disclosure, and redemption requirements for ARTs and EMTs. - Hong Kong Monetary Authority. “Regulatory Regime for Stablecoin Issuers.” July 13, 2026.
https://www.hkma.gov.hk/eng/key-functions/international-financial-centre/stablecoin-issuers/
Use: Official description of Hong Kong’s stablecoin issuer licensing regime. - Hong Kong Government. 2025. “Stablecoins Ordinance to Commence Operation on August 1, 2025.” June 5, 2025.
https://www.info.gov.hk/gia/general/202506/06/P2025060600275.htm
Use: Official commencement notice for Hong Kong’s Stablecoins Ordinance. - Hong Kong e-Legislation. “Cap. 656 Stablecoins Ordinance.”
https://www.elegislation.gov.hk/hk/cap656
Use: Primary legal text for Hong Kong’s stablecoin regime. - Hong Kong Monetary Authority. 2025. “Robust and Sustainable Development of Stablecoins.” June 23, 2025.
https://www.hkma.gov.hk/eng/news-and-media/insight/2025/06/20250623/
Use: HKMA’s policy rationale for licensing fiat-referenced stablecoin issuers. - Banco Central do Brasil. “Regulation of Virtual Asset Service Providers” and related resolutions.
https://www.bcb.gov.br/
Use: Primary source for Brazil’s VASP authorization, stablecoin/FX treatment, reporting obligations, and payment-system rules. Verify the current resolution numbers and effective dates directly on the BCB site before submission. - Banco Central do Brasil. 2026. Statements and rules on stablecoin conversions and anti-money-laundering treatment.
Use BCB press releases, board speeches, and official resolutions rather than crypto-media summaries.
Use: Brazil case for the policy section, especially the treatment of stablecoin conversion as potentially within the FX and AML perimeter.
Stablecoin design and risk
- Gorton, G. B., and J. Zhang. 2023. “Taming Crypto.” Journal of Economic Perspectives 37, no. 2: 175–206.
Use: Economic analysis of crypto assets, stablecoins, and financial-stability concerns. Use for the theoretical framing of stablecoins as monetary instruments. - Gorton, G. B., and J. Zhang. 2021. “Taming Crypto.” NBER Working Paper No. 29322.
https://www.nber.org/papers/w29322
Use: Earlier working-paper version and theoretical background on stablecoin risk. - Klages-Mundt, A., et al. 2020. “Stablecoins 2.0: Economic Foundations and Risk-Based Models.”
Use: Technical and economic framework for stablecoin design, collateralization, and peg maintenance. - Makarov, I., and A. Schoar. 2021. “Cryptocurrencies and Decentralized Finance.” Brookings Papers on Economic Activity.
Use: Foundational academic treatment of crypto-market structure, arbitrage, and DeFi. - Makarov, I., and A. Schoar. 2022. “Cryptocurrency Trading and Its Implications for Investor Protection and Financial Stability.”
Use: Evidence on crypto-market segmentation, arbitrage limits, and price divergence across jurisdictions. - Cong, L. W., et al. 2023. “Decentralized Finance and Stablecoins.”
Use the most relevant peer-reviewed version available through a major finance or economics journal.
Use: Stablecoin design, collateralization, and DeFi-market mechanisms. - BIS. 2023. “The Crypto Ecosystem: Key Elements and Risks.” Committee on Payments and Market Infrastructures and Board of the International Organization of Securities Commissions.
Use: Systemic-risk framing for stablecoins, exchanges, DeFi, and crypto-market infrastructure. - BIS. 2023. “The Crypto Ecosystem: Key Elements and Risks.” Committee on Payments and Market Infrastructures.
https://www.bis.org/publ/cpmi/misc101.htm
Use: Background on stablecoin reserve risk, redemption risk, market structure, and financial-stability concerns.
Dollarization and currency substitution
- Calvo, G. A., and C. A. Végh. 1992. “Currency Substitution in Developing Countries: An Introduction.” IMF Working Paper WP/92/2.
Use: Foundational framework for currency substitution, dollarization, and the role of foreign-currency assets in developing economies. - Levy Yeyati, E. 2006. “Financial Dollarization: Evaluating the Consequences and Policy Responses.” IMF Working Paper WP/06/187.
Use: Literature anchor for dollarization, balance-sheet effects, and policy trade-offs. - De Nicoló, G., et al. 2005. “Dollarization of the Banking System: Good or Bad?” IMF Working Paper WP/05/114.
Use: Financial dollarization and monetary-policy transmission. - Reinhart, C. M., and K. S. Rogoff. 2004. “The Modern History of Exchange Rate Arrangements: A Reinterpretation.” Quarterly Journal of Economics 119, no. 1: 1–48.
Use: Exchange-rate-regime classification and devaluation measurement. - Ilzetzki, E., C. M. Reinhart, and K. S. Rogoff. 2019. “Exchange Arrangements Entering the Twenty-First Century: Which Anchor Will Hold?” Quarterly Journal of Economics 134, no. 2: 599–646.
Use: Modern exchange-rate-regime classification and de facto exchange-rate arrangements.
Capital controls and FX premiums
- Fernández, A., et al. 2016. “Capital Control Measures: A New Dataset.” IMF Economic Review 64, no. 3: 548–574.
Use: Alternative capital-control index and robustness check against IMF AREAER. - Klein, M. W., and J. C. Shambaugh. 2015. “Capital Controls and the Real Exchange Rate.” Journal of International Economics 96, no. 2: 213–228.
Use: Capital controls and exchange-rate dynamics. - Reinhart, C. M., and K. S. Rogoff. 2004. “The Modern History of Exchange Rate Arrangements: A Reinterpretation.”
Use: Duplicate reference with source 73; retain only one version in the final bibliography. - International Monetary Fund. “Annual Report on Exchange Arrangements and Exchange Restrictions.”
Use: Primary source for capital-control coding; see source 18. - Reinhart, C. M., and K. S. Rogoff. 2002. “The Modern History of Exchange Rate Arrangements: A Reinterpretation.” NBER Working Paper No. 8963.
Use: Background for exchange-rate-regime classification and parallel-market premium measurement.
Mobile money and digital payments
- Jack, W., and T. Suri. 2014. “Risk Sharing, Transactions Costs, and the Adoption of Mobile Money.” American Economic Review 104, no. 1: 183–223.
Use: Foundational evidence on mobile-money adoption and transaction-cost reduction. - Suri, T., and W. Jack. 2016. “The Long-Run Poverty and Gender Impacts of Mobile Money.” Science 354, no. 6317: 1288–1292.
Use: Long-run development effects of mobile money. - Aker, J. C., et al. 2016. “Payment Mechanisms and Antipoverty Programs: Evidence from a Mobile Money Cash Transfer Experiment in Niger.” Economic Development and Cultural Change 65, no. 1: 1–37.
Use: Mobile-money payment mechanisms and transaction-cost evidence. - GSMA. “State of the Industry Report on Mobile Money.”
https://www.gsma.com/sotir/
Use: Annual mobile-money adoption, transaction, agent-network, and regional data. - World Bank. “Digital Payments.”
https://www.worldbank.org/en/topic/digitaldevelopment
Use: Background on digital-payment infrastructure and financial inclusion.
On-chain measurement and attribution
- Chainalysis. “Crypto Crime Report.” Various years.
https://www.chainalysis.com/
Use: Sanctions, illicit-finance, scam, and laundering typologies. Use with caution and distinguish observed transfers from proven criminal activity. - Elliptic. “Typologies Report.” Various years.
https://www.elliptic.co/
Use: Compliance and illicit-finance typologies; useful for defining risk categories, not for measuring aggregate payment activity. - TRM Labs. “Illicit Crypto Economy Report.” Various years.
https://www.trmlabs.com/
Use: Sanctions, laundering, and illicit-finance risk framing. - Nansen. “Wallet Labels” and research reports.
https://www.nansen.ai/
Use: Address-labeling examples and wallet-intelligence methods. Use only where methodology is transparent and reproducible. - Arkham Intelligence. “Entity Labels.”
https://www.arkhamintelligence.com/
Use: Supplementary wallet/entity attribution; treat as low-to-medium confidence unless independently validated.