
The Top Crypto Market Data Sites combine reliable pricing, Bitcoin dominance, total market capitalization, 24-hour trading volume, derivatives, and API access in one research workflow. TradingView is useful for technical analysis, while CoinMarketCap supports broad asset discovery and the CoinMarketCap API can deliver live global cryptocurrency market data. Compare timestamps, exchange coverage, fiat or cryptocurrency symbols, and methodology before trusting a signal. For an accessible starting point, practical crypto market insights can complement structured dashboards.

Professional crypto dashboard showing Bitcoin dominance, total capitalization, volume, index performance, and API monitoring panels
Why Reliable Crypto Market Overview Platforms Matter in 2026
Why reliable crypto market overview platforms matter in 2026 is clear: fragmented liquidity, rapidly changing derivatives, and institutional ETF activity can make a single price misleading. A dependable platform discloses exchange selection, calculation windows, listing rules, and update frequency. Analysts should compare spot prices with perpetual funding, Open Interest, Crypto ETFs Net Flow, Volmex Implied Volatility, ETH Gas, and stablecoin movements before forming a view. Reliable Market data also preserves historical cryptocurrency market data, allowing researchers to distinguish a genuine regime change from a temporary venue anomaly. Professional users should record source timestamps and response status alongside every observation.

Multi-panel crypto overview displaying spot prices, ETF flows, open interest, volatility, gas, and stablecoin liquidity
Trusted Information Sources vs. Noisy Price Aggregators

Trusted information sources vs. noisy price aggregators differ mainly in transparency and editorial discipline. A reputable service explains whether volume is filtered, how outliers are removed, and which venues contribute to each asset. CoinDesk, exchange-native feeds, and carefully documented index providers can support research, but users should still verify methodology and editorial policies. Independent journalists and analysts should separate reported facts from sponsored commentary and preserve editorial independence.
Aggregators that rank tokens only by sudden percentage gain may amplify illiquid markets, wash trading, or stale quotes. A practical test is to compare several venues, inspect spread depth, and reject a feed whose price differs materially without an identifiable liquidity reason.
How to Test Data Accuracy Across Crypto Markets
How to test data accuracy across crypto markets requires a repeatable sample rather than a single screenshot. Select liquid and thinly traded assets, record bid, ask, last trade, volume, and timestamp from at least three sources, then calculate percentage differences. Repeat during quiet periods and major announcements.
Check whether candles use exchange time or UTC, whether missing intervals are backfilled, and whether token redenominations are handled correctly. Compare a provider’s total market capitalization with independently reconstructed circulating supply multiplied by price. Document every discrepancy, because a consistent five-basis-point spread may be acceptable while a sporadic ten-percent jump signals corrupted or delayed data.
Red Flags of Unreliable Market Data Feeds
Red flags of unreliable market data feeds include unexplained volume spikes, identical prices across supposedly independent venues, missing timestamps, unstable asset identifiers, and historical revisions without change logs. Beware providers that advertise real-time updates but poll irregularly, hide rate limits, or return HTTP success with incomplete records. A robust feed identifies exchange outages, marks estimated values, and distinguishes null from zero. It should also expose precision and quote currency so a user does not confuse cents with dollars. Risk analysis becomes unreliable when a dashboard silently mixes spot, futures, and index prices. Test failover behavior before connecting any automated strategy or treasury report.
Key Features That Separate Elite Analytics Solutions
Key features that separate elite analytics solutions include normalized exchange data, transparent methodology, historical retention, programmable alerts, and permissioned API access. Strong platforms support on-chain analytics, stablecoin research, technical analysis, and quantitative strategies without forcing users to export each dataset manually. Treasury managers need audit trails and reproducible calculations, while VCs data-driven investing teams need clean sector, liquidity, and valuation comparisons. A mature digital asset platform treats market infrastructure as a service: it documents schemas, version changes, and service-level expectations. Useful vendors may also explain Oracle services, Tokenize workflows, and AML compliance data rather than presenting a single opaque score.
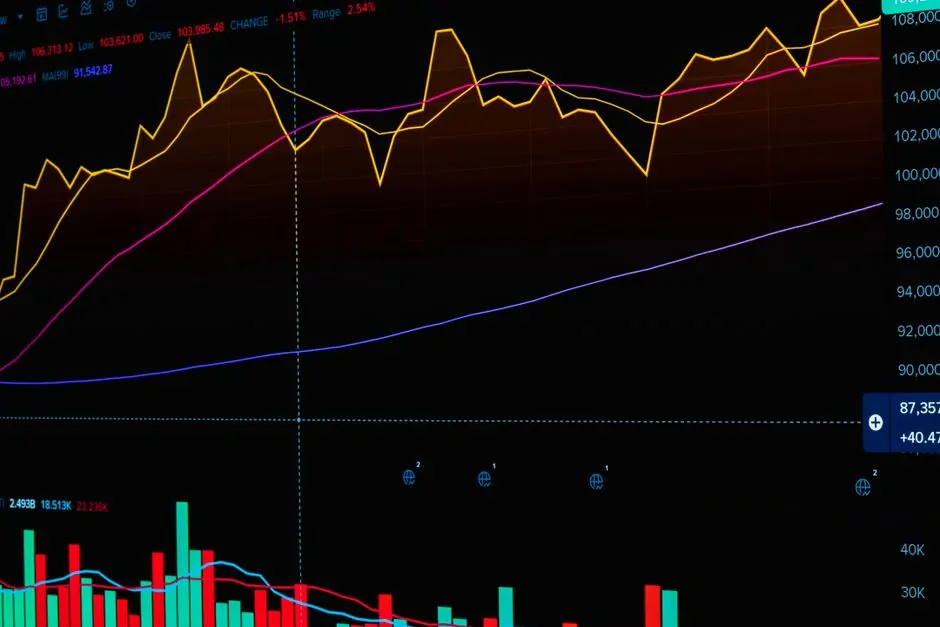
Institutional analytics workspace comparing normalized exchange feeds, on-chain metrics, alerts, and downloadable research tables
Red Flags of Unreliable Market Data Feeds
Real-time latency benchmarks for live crypto prices should measure exchange event time, provider receipt time, transformation time, and client display time separately. A WebSocket feed may arrive in tens of milliseconds, while a browser dashboard can lag because of batching, rendering, or network congestion. Benchmark at market open, during liquidations, and during ordinary trading; report median, ninety-fifth-percentile, and maximum delay. ICE Data Services and FactSet illustrate why institutional buyers evaluate data lineage and service reliability, not merely headline speed. For a trading decision, a stable forty-millisecond stream can be more useful than an inconsistent ten-millisecond claim. Store raw timestamps so performance can be audited later.
Coverage Depth: Coins, Pairs, and Derivatives
Coverage depth: coins, pairs, and derivatives determines whether a platform supports real research rather than only popular tickers. Count unique assets, quote currencies, venues, perpetual contracts, dated futures, options, funding rates, and liquidation events. Confirm whether wrapped assets, bridged tokens, and migrated contracts retain linked histories. Derivatives data should identify contract type and settlement currency, because comparing inverse and linear futures can distort exposure. A serious provider also supplies delisting notices and symbol mapping. Coverage should be judged by usable liquidity and clean continuity, not by a large token count that includes inactive or duplicated listings.
How Live Crypto Prices and Market Data Shape Trading Decisions
How live crypto prices and market data shape trading decisions depends on context, not speed alone. A trader may combine price momentum with Bitcoin dominance, ETF flows, funding, Open Interest, and order-book imbalance to create actionable signals. A portfolio manager may instead use hourly observations to control exposure and rebalance risk. The same quote can imply different decisions when liquidity, volatility, and time horizon change. Build a documented workflow that records the source, timestamp, transformation, and rule that converted an observation into an order. This prevents hindsight bias and reveals whether the strategy depends on one fragile feed.
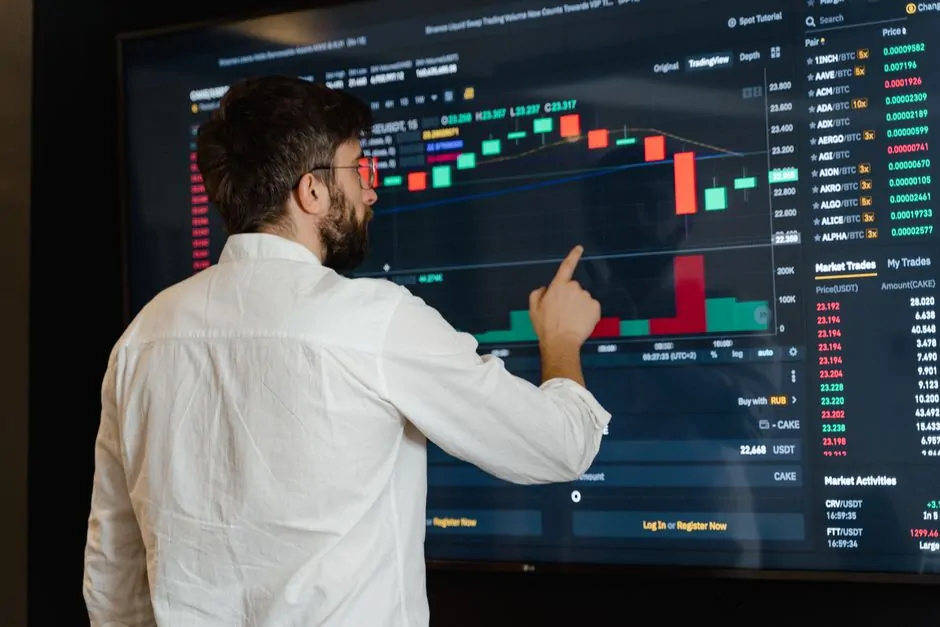
Trader reviewing live crypto prices beside dominance, funding, ETF flow, and risk-control charts
Real-Time Feeds vs. Delayed Snapshots: What Traders Lose
Real-time feeds vs. delayed snapshots: what traders lose is most visible during fast repricing. A delayed snapshot can understate spread widening, miss a liquidation cascade, or trigger an order after the intended entry has disappeared. It can also produce false confidence when a displayed volume number belongs to an earlier interval. Users should label every chart as live, delayed, cached, or end-of-day and test the exact delay under load. For discretionary analysis, a fifteen-minute delay may be acceptable; for execution, it may invalidate a signal. Always compare displayed time with exchange event time before judging performance.
Red Flags of Unreliable Market Data Feeds
Case Study: A 30-Second Delay That Cost $12K shows how operational details become financial outcomes. Suppose a strategy allocates $240,000 to a breakout and expects a 5% protective exit. A dashboard delayed by thirty seconds displays a favorable move, but the venue has already reversed 1.2%; a rushed order fills through a widened spread and realizes a $12,000 loss. The lesson is not that every delay causes loss, but that latency must be tested against strategy holding time, liquidity, and slippage. A post-trade review should compare intended, signal, submission, acknowledgment, and fill timestamps, then determine whether a faster feed or stricter circuit breaker would have changed the result.
When Historical Market Data API Calls Beat Live Streams
When historical market data API calls beat live streams, the goal is usually validation rather than execution. Researchers can replay market conditions, test a rebalance rule, calculate drawdowns, and examine how Bitcoin dominance behaved across previous cycles. The endpoints /v1/global-metrics/quotes/latest and /v1/global-metrics/quotes/historical serve different purposes: the first captures current global metrics, while the second supports dated comparisons. Use the provider’s API pricing page to confirm retention, request quotas, and commercial rights. Historical cryptocurrency market data must preserve timezone, revisions, delistings, and survivorship limitations, otherwise backtests will exaggerate performance.
Building a Personal Crypto Market Dashboard
Building a personal crypto market dashboard starts with a small set of decisions: define the assets, quote currency, refresh interval, and actions that each metric should support. A useful screen may show Bitcoin price, dominance, total capitalization, CMC20 performance, ETF net flow, Open Interest, implied volatility, ETH Gas, and stablecoin balances. Avoid filling the page with decorative indicators; every panel should answer a specific question. Use color sparingly, display units clearly, and retain a timestamp beside each value. A lightweight dashboard can begin with spreadsheets and API calls, then evolve into a database-backed application once refresh volume and user count justify it.
Choosing Widgets for Crypto Total Market Cap
Choosing widgets for crypto total market cap requires understanding what each calculation includes. Some providers include only circulating supply, while others estimate unavailable supply or exclude stablecoins and wrapped assets. Pair a headline capitalization chart with Bitcoin share, altcoin capitalization, volume, and a methodology note. Add a period-change widget so a rising market can be separated from a one-asset surge. Verify that the chart uses consistent asset eligibility through time; otherwise index growth may reflect new listings rather than appreciation. A compact dashboard should expose the source and update timestamp when the number informs allocation or reporting.
Real-Time Latency Benchmarks for Live Crypto Prices
Alerts that actually matter for volatile markets are rule-based, prioritized, and resistant to noise. Useful examples include a five-minute move beyond a tested threshold, a sudden funding reversal, Open Interest rising while spot momentum stalls, or Bitcoin dominance breaking a defined range. Add cooldown periods and confirmation windows so one bad tick does not generate dozens of notifications. Alerts should state the observed value, baseline, source, timestamp, and suggested review action. Never let an alert place an order without independent risk checks, position limits, and outage handling. The best notification system reduces attention demands while preserving context for a human decision.
Altcoin Season Index and CoinMarketCap 20 Index: Gauging Broad Momentum
Altcoin Season Index and CoinMarketCap 20 Index: gauging broad momentum works best when the two measures are treated as complementary. The Altcoin Season Index asks whether a broad group of altcoins has outperformed Bitcoin over a defined lookback, while CMC20 represents a rules-based basket of major assets. One can rise while the other remains flat if gains are concentrated in smaller tokens or if large constituents lag. Check rebalance dates, eligibility rules, stablecoin treatment, and weighting caps before comparing returns. Combine both indexes with Bitcoin dominance and liquidity conditions rather than interpreting a threshold as a guaranteed trading signal.
How the Altcoin Season Index Signals Rotation
How the Altcoin Season Index signals rotation is easiest to understand through relative performance. When many eligible altcoins beat Bitcoin over the lookback period, the reading rises and suggests breadth rather than a single-token rally. Confirm the move with altcoin volume, sector participation, and falling or stable Bitcoin dominance. A rising index during declining total capitalization may reflect defensive rotation inside a weak market, not healthy expansion. Define the lookback, universe, and rebalance treatment before comparing readings from different providers. Use the index as a screening tool, then assess liquidity, protocol risk, and derivatives positioning for each candidate.
Reading the 75/25 Threshold for Altcoin Strength
Reading the 75/25 threshold for altcoin strength requires treating 75 as a broad confirmation zone and 25 as a broad Bitcoin-led zone, not as automatic buy or sell commands. Thresholds can remain extreme while prices reverse, especially when a small number of assets dominate returns. Add a trend filter, volatility constraint, and maximum allocation rule. A portfolio might require two consecutive readings above 75 plus expanding volume before increasing altcoin exposure, while a reading below 25 could trigger review rather than immediate liquidation. Document the rule before observing the outcome to avoid threshold hindsight.
Real-Time Latency Benchmarks for Live Crypto Prices
Historical accuracy of altcoin season calls should be evaluated with dated signals, publication timing, and investable returns. Record the index value when the signal became available, then measure subsequent Bitcoin-relative performance after fees, spread, and rebalancing costs. Separate a correct direction from a profitable trade, since an altcoin basket can outperform briefly while suffering severe drawdown. Avoid survivorship bias by retaining tokens that later disappeared and use only information available at each historical date. A useful report includes hit rate, average gain, average loss, maximum drawdown, and performance across bull, bear, and sideways regimes.
Key Features That Separate Elite Analytics Solutions
CoinMarketCap 20 Index as a blue-chip crypto barometer offers a compact view of large, established digital assets, but its construction matters more than its label. Review constituent eligibility, liquidity screens, weighting limits, rebalancing frequency, and treatment of forks or migrated tokens. Compare its return with Bitcoin, Ethereum, total capitalization, and a broader equal-weight basket. A concentrated index may behave like a risk-on proxy, whereas a capped index can reduce the influence of one very large asset. Investors should also inspect tracking differences if the index is used as a benchmark for a fund or structured product.

Index methodology graphic showing CMC20 constituents, eligibility filters, caps, rebalancing, and benchmark comparisons
Real-Time Latency Benchmarks for Live Crypto Prices
Constituents and weighting changes in 2026 should be reviewed at every scheduled rebalance and after exceptional events. A token entering the basket can change sector exposure, liquidity, and volatility even when the index level appears stable. Capture the before-and-after weights, effective date, prices, and rationale, then attribute performance to selection versus market movement. Confirm whether the methodology excludes stablecoins, privacy assets, wrapped instruments, or tokens with insufficient trading history. For portfolio reporting, apply changes on the documented effective date rather than retroactively. This discipline prevents accidental look-ahead bias and clarifies why an index diverged from a passive holding.
Coverage Depth: Coins, Pairs, and Derivatives
Comparing CMC20 to Bitcoin-only benchmarks reveals whether performance comes from broad participation or one dominant asset. Calculate rolling volatility, drawdown, correlation, and upside capture over identical periods. During a Bitcoin-led rally, CMC20 may lag despite positive returns; during an altcoin rotation, it may outperform with materially higher risk. Use total-return assumptions consistently and account for rebalancing, custody, and implementation costs. A benchmark comparison should include a chart and a table of dates, not just a headline percentage. The result helps investors choose a reference that matches the portfolio’s actual opportunity set.
Bitcoin Dominance and Crypto Total Market Cap: The Macro Duo
Bitcoin Dominance and Crypto Total Market Cap: the macro duo provides a simple map of capital concentration and market scale. Rising capitalization with falling dominance often indicates broad altcoin participation, while rising capitalization with rising dominance suggests Bitcoin-led expansion. Falling values in both measures usually signal contraction, though stablecoin issuance and supply methodology can complicate interpretation. Track the numerator, denominator, circulating-supply assumptions, and timestamp for each series. Combine the pair with volume, ETF flows, and volatility to avoid reading a percentage share in isolation. This framework is useful for allocation review, risk analysis, and communicating market structure to non-specialist stakeholders.
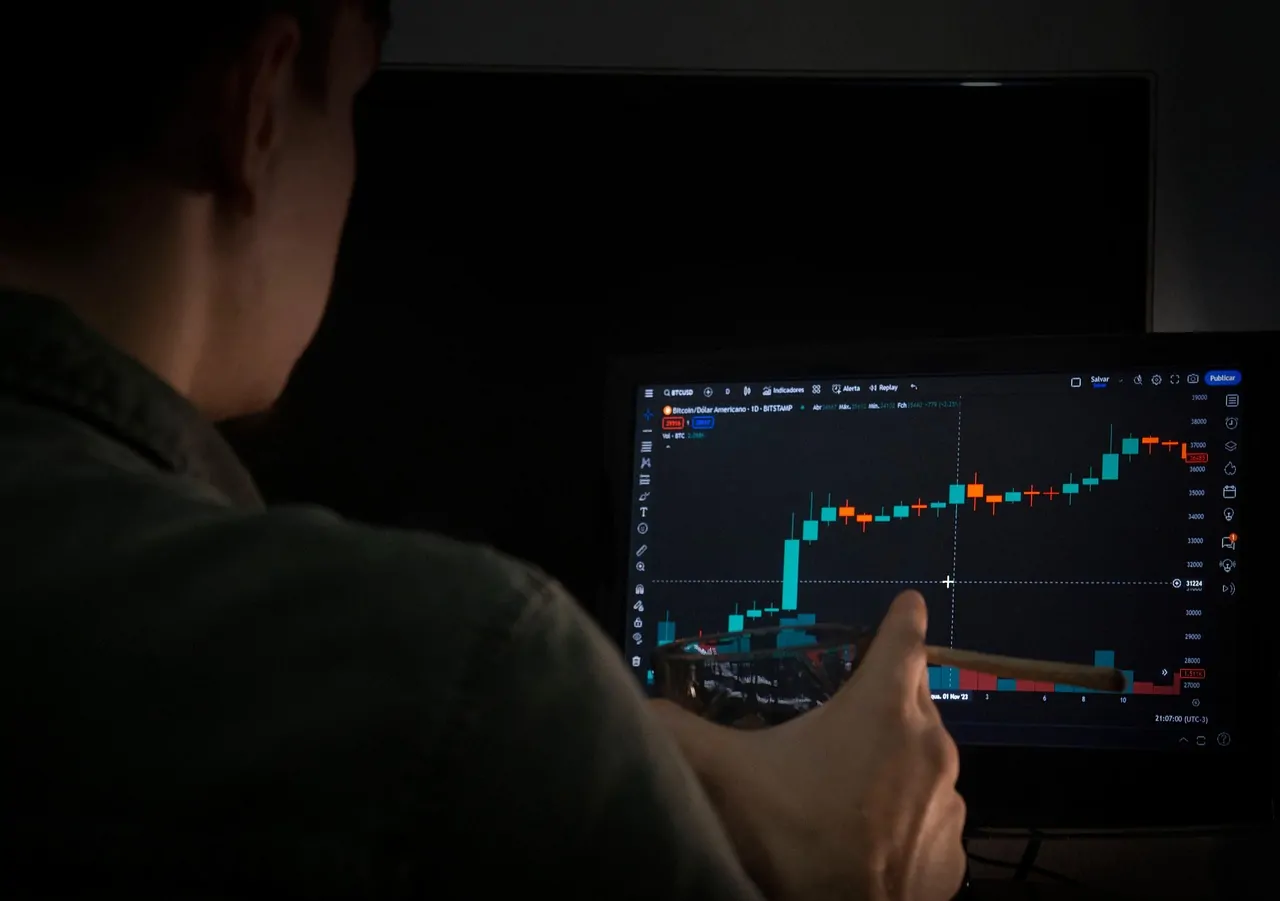
Macro crypto chart pairing Bitcoin dominance with total market capitalization across expansion and contraction regimes
Coverage Depth: Coins, Pairs, and Derivatives
What rising Bitcoin dominance means for altcoins depends on whether Bitcoin is appreciating or merely losing less. If dominance rises while total capitalization expands, capital may be concentrating in Bitcoin during a cautious risk-on phase. If dominance rises while capitalization falls, investors may be reducing exposure broadly and using Bitcoin as the relative safe asset. Examine altcoin/BTC pairs, stablecoin liquidity, sector breadth, and funding before acting. A dominance increase is therefore a context signal, not proof that every altcoin will decline. Set exposure rules around liquidity and drawdown rather than using a single percentage as a market-timing command.
Divergences Between Dominance and Total Cap Explained
Divergences between dominance and total cap explained begin with their different mathematical roles. Total capitalization can rise because prices increase, supply expands, or new assets enter the universe; dominance is a ratio that can move lower even during a strong Bitcoin rally if altcoins rise faster. Conversely, dominance can increase while total capitalization declines when altcoins fall more sharply. Investigate stablecoin supply, index inclusion, and circulating-supply revisions before calling a divergence a trend. Plot both series on synchronized dates and annotate major methodology changes. Only then can the divergence support a defensible macro conclusion.
Crypto ETFs Net Flow, Open Interest, and Volmex Implied Volatility: Sentiment Signals
Crypto ETFs Net Flow, Open Interest, and Volmex Implied Volatility: sentiment signals become powerful when read together. ETF net flow can indicate institutional demand, Open Interest shows derivative positioning, and implied volatility prices expected movement rather than direction. Strong inflows with moderate leverage may support a healthier trend than inflows accompanied by crowded futures and sharply rising volatility. Check whether flows are gross or net, whether Open Interest is aggregated across venues, and which horizon the volatility index represents. These measures should inform position sizing and scenario planning, not replace liquidity checks or fundamental research.

Institutional sentiment dashboard combining ETF net flow bars, Open Interest curves, and implied volatility term structure
Key Features That Separate Elite Analytics Solutions
Tracking Crypto ETFs Net Flow for institutional clues requires separating creations, redemptions, transfers, and reporting delays. Daily flow can be noisy because one allocation or rebalance may dominate the total, so compare it with assets under management, spot volume, and multi-day persistence. A flow number is not automatically directional evidence: hedging, arbitrage, or basis trades can produce inflows without equivalent outright buying. Record publication time and fund coverage, then compare the series with Bitcoin returns using a consistent close. The most useful conclusion is usually probabilistic, such as strengthening demand confirmation, rather than a claim that flows predict the next candle.
Real-Time Latency Benchmarks for Live Crypto Prices
Daily vs. weekly net flow trends to watch answer different questions. Daily data highlights event-driven demand and can reveal abrupt institutional reactions, while weekly aggregation reduces reporting noise and shows whether capital is persistently entering or leaving. Use both: flag an unusually large daily observation, then require confirmation from a rolling five- or seven-day sum. Compare flows with price, basis, and volume to identify divergence. A rising price with persistent outflows may reflect short covering or limited supply, whereas falling price with inflows may indicate absorption. Keep the aggregation method stable so historical comparisons remain meaningful.
Coverage Depth: Coins, Pairs, and Derivatives
How ETF flows correlate with spot price moves should be tested with lagged relationships rather than visual impressions. Calculate same-day and one-to-five-day correlations, control for market-wide returns, and examine positive and negative flow periods separately. Correlation can change across regimes and does not prove that ETF activity caused the move. Use event windows around approvals, rebalances, and macro announcements, while accounting for publication timing. A practical model can treat flow as one feature beside volume, volatility, and futures basis. Validate out of sample and include transaction costs before using any relationship in a live allocation process.
Open Interest and Volmex Implied Volatility as Risk Gauges
Open Interest and Volmex Implied Volatility as risk gauges help identify when a seemingly calm market contains fragile positioning. Rising Open Interest alongside compressed realized volatility can signal crowded leverage, while rising implied volatility indicates that options markets are pricing larger future moves. Compare perpetual and dated-futures exposure, funding, skew, and term structure rather than relying on one aggregate number. A risk committee can translate these observations into smaller position limits, wider stress scenarios, or additional collateral. Volatility is not inherently bearish; it is a measure of expected movement and the price investors pay for optionality.

Risk-monitoring screen showing Open Interest, funding, realized volatility, implied volatility, skew, and liquidation levels
Coverage Depth: Coins, Pairs, and Derivatives
Spotting overleveraged conditions before liquidation cascades requires combining leverage indicators with market depth. Watch rapid Open Interest growth, extreme funding, concentrated liquidations, thin order books, and a widening difference between futures and spot. A small price move can force deleveraging when many traders hold similar positions, so stress-test a two- or three-standard-deviation move at several liquidity levels. Set alerts for changes in funding and basis, not only absolute extremes. Avoid assuming that high Open Interest is bearish: it can support liquidity when positions are balanced. The warning is usually synchronized crowding, poor depth, and accelerating forced flow.
Using Volmex Implied Volatility to Time Entries
Using Volmex Implied Volatility to time entries means using expected movement to size and structure trades, not treating volatility as a directional oscillator. Compare implied volatility with realized volatility, percentile rank, term structure, and options skew. When implied volatility is unusually high, a smaller position or defined-risk option may be preferable; when it is unusually low before a known catalyst, avoid assuming the eventual move will be small. Establish entry, invalidation, and maximum loss before execution. Volatility signals improve timing only when paired with liquidity, catalyst awareness, and disciplined risk controls.
ETH Gas and Stablecoin Insider: On-Chain Cost and Liquidity Signals
ETH Gas and Stablecoin Insider: on-chain cost and liquidity signals connect market behavior with network activity. ETH Gas reflects demand for block space, although a spike can come from a single application, token launch, or congestion event rather than broad risk appetite. Stablecoin supply, exchange balances, and transfer flows help indicate available settlement liquidity, but labels and wallet heuristics are imperfect. Combine gas with transaction counts, bridge activity, decentralized-exchange volume, and stablecoin minting or redemption. Onchain data should be timestamped by block and interpreted alongside market data, because on-chain settlement may lag or lead exchange prices depending on the event.
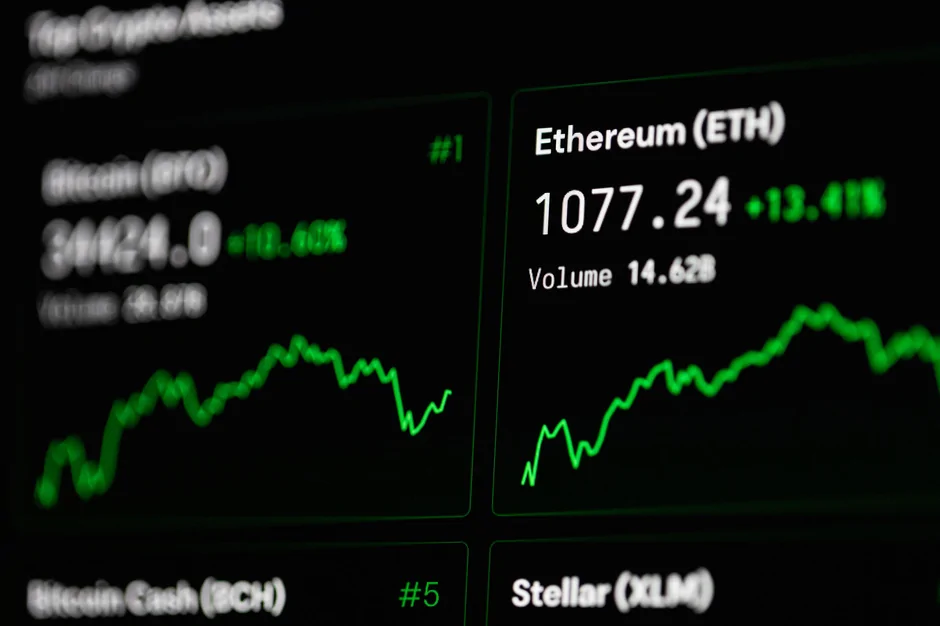
Ethereum on-chain dashboard showing gas fees, stablecoin transfers, exchange balances, blocks, and decentralized-exchange volume
Why ETH Gas Spikes Precede Market Churn
Why ETH Gas spikes precede market churn is partly explained by competition for block space during launches, liquidations, and rapid arbitrage. Higher fees can signal urgent activity, but they can also reduce participation and create execution risk for smaller traders. Compare base fee, priority fee, transaction count, and the applications consuming capacity. A sustained increase across several blocks is more informative than one isolated peak. Traders should incorporate estimated gas into expected returns, especially for on-chain strategies, and maintain a fallback route when fees or confirmation times exceed predefined limits. Gas is an activity clue, not a guaranteed price forecast.
Stablecoin Insider Flows as Dry Powder Indicator
Stablecoin Insider flows as a dry powder indicator require careful distinction between issuance, transfers, exchange deposits, and internal wallet movements. Growing balances on trading venues may represent purchasing capacity, but they can also support derivatives collateral or routine settlement. Track net exchange flows, supply changes, velocity, and concentration by chain. Label heuristics and refresh dates should be visible because wallet attribution can change. Combine stablecoin observations with spot volume, ETF flows, and lending rates before concluding that capital is ready to buy. The signal is strongest when independent measures point in the same direction and remain persistent over several sessions.
Crypto Market Analysis Tools Compared: TradingView, CoinDesk, and Beyond
Crypto market analysis tools compared: TradingView, CoinDesk, and beyond should be assessed by use case. TradingView excels at chart layouts, alerts, indicators, and community-published scripts; CoinDesk adds news and editorial context; specialized providers may offer on-chain analytics, derivatives, or institutional reference data. Review source transparency, export rights, API availability, and correction procedures before selecting a platform. A digital asset platform for execution should not automatically be treated as an impartial research source. Users can supplement editorial research with security-focused web resources, but every external claim should be checked against primary data and documented methodology.

Comparison table and screens for TradingView charts, CoinDesk news, on-chain analytics, derivatives, and API research tools
TradingView: Charting Power Meets Social Sentiment
TradingView: charting power meets social sentiment through flexible layouts, multi-timeframe analysis, alerts, and a broad community of published indicators. It is effective for technical analysis when users understand the source and construction of each symbol. Social ideas can reveal market attention, but popularity is not evidence of liquidity, accuracy, or risk-adjusted performance. Validate scripts against raw exchange data and inspect whether an indicator repaints or uses future information. For discretionary work, save chart versions and alert conditions so decisions remain reproducible. TradingView is strongest as a visualization and monitoring layer, not as a substitute for specialized on-chain or institutional datasets.
Coverage Depth: Coins, Pairs, and Derivatives
Custom scripts for Altcoin Season Index overlays can compare Bitcoin-relative returns, breadth, dominance, and CMC20 behavior in one chart. Define the asset universe, lookback, missing-data rule, and rebalance treatment explicitly before coding. Use confirmed bars and avoid look-ahead bias when an index value depends on future constituent knowledge. Add labels for threshold crossings and export the underlying series for independent verification. A script should expose assumptions rather than hide them behind a single colored line. Test it across volatile and quiet periods, then treat the overlay as a research aid instead of an automated buy signal.
Limitations of TradingView for On-Chain Data
Limitations of TradingView for on-chain data include incomplete wallet labeling, limited event semantics, chain-specific coverage, and possible differences between displayed aggregates and node-level records. A chart can show a transaction count without explaining whether bots, internal transfers, or contract calls drove it. For serious on-chain analytics, retrieve chain-native data or use a provider that documents entity attribution, block finality, and reorganization handling. TradingView remains useful for placing on-chain observations beside price and volume, but users should preserve the original query and provider version. This separation improves auditability and prevents visual convenience from becoming analytical overconfidence.
CoinDesk’s Top Cryptocurrency Price and Market Cap: Editorial Context
CoinDesk’s Top Cryptocurrency Price and Market Cap: editorial context helps readers connect numerical market data with events, narratives, and reported developments. Price tables are useful for orientation, but users should inspect timestamp, quote currency, exchange coverage, and asset methodology before using a value in a model. Editorial policies should distinguish news reporting, sponsored material, analysis, and corrections. Readers can compare coverage with primary disclosures and filings, while journalists should explain uncertainty rather than presenting a volatile quote as a settled fact. This approach supports editorial independence and reduces the risk that a compelling headline will override measurable liquidity or valuation evidence.
How CoinDesk Curates Crypto Prices and Market Caps
How CoinDesk curates crypto prices and market caps should be evaluated through its published methodology, source selection, update cadence, and correction process. Ask whether figures are aggregated, indexed, or supplied by a particular venue, and whether circulating supply is estimated. Compare a sample of large and small assets against exchange and index-provider values at the same timestamp. Editorial context can explain why a market moved, but the numerical series still needs independent validation. For institutional use, archive the page, timestamp, and methodology version. That practice protects reports when symbols, rankings, or supply estimates change after publication.
Integrating CoinDesk Data into Your Workflow
Integrating CoinDesk data into your workflow works best when editorial information and machine-readable market data remain separate but linked. Store the article identifier, publication time, cited assets, event category, and relevant price window, then join those fields to a validated API dataset. Do not scrape a headline into an automated trade rule without human review and licensing approval. News can provide catalyst labels for event studies, while quantitative data measures the market response. A well-designed workflow preserves both the original text and the transformation steps, allowing analysts to reproduce conclusions and correct mistaken event classifications.
Top Gainers and Market Cap Ranking: Daily Movers and Shakers
Top gainers and market cap ranking: daily movers and shakers are useful discovery tools, but they can reward illiquidity and short-lived pumps. Screen for minimum traded value, spread, listing age, and venue count before interpreting a percentage change. A token up 40% on modest volume may be less actionable than a 4% move in a deep market. Add circulating market capitalization, sector, volatility, and catalyst fields to the ranking. Use rankings to generate a research queue, not a purchase list. Verify contract addresses and market pairs to avoid confusing similarly named assets or manipulated venues.
Screening Top Gainers Without Chasing Pumps
Screening top gainers without chasing pumps begins with liquidity and persistence filters. Require a minimum dollar volume, multiple reputable venues, acceptable spread, and confirmation over more than one interval. Investigate unlocks, listings, governance votes, protocol incidents, and social-driven activity before attributing the move to durable demand. Compare spot volume with derivatives volume and inspect whether funding is becoming extreme. A disciplined screen can rank candidates by momentum, liquidity, and event quality while excluding suspicious outliers. The objective is not to remove risk, but to ensure that a potential trade has an identifiable thesis and an executable market.
Case Study: A 30-Second Delay That Cost $12K
Using market cap ranking to find undervalued sectors requires comparing scale with adoption, liquidity, revenue, developer activity, and risk. Group assets by sector, calculate median capitalization and performance, and examine whether a small number of tokens distort the result. Low capitalization is not proof of undervaluation; it may reflect weak demand, unlock pressure, or technical failure. Add stablecoin-adjusted volume and circulating-supply growth to the comparison. A useful research table records the investment thesis, disconfirming evidence, valuation proxy, and liquidity limit for each sector. Ranking then becomes a structured starting point rather than a simplistic value signal.
Crypto Data APIs for Developers and Analysts
Crypto data APIs for developers and analysts provide the repeatability that dashboards often lack. Before integration, define required assets, fields, resolution, historical depth, latency, licensing, and acceptable error rates. The CoinMarketCap API may support listings, quotes, global metrics, and historical endpoints, while exchange APIs can provide venue-specific trades and order books. Map identifiers carefully and preserve raw responses beside transformed tables. Include retries, pagination, rate-limit handling, authentication rotation, and schema monitoring from the first prototype. A reliable API layer turns Market data into reusable research infrastructure rather than a collection of copied screenshots.
Live Market Data API: Architecture and Rate Limits
Live Market data API: architecture and rate limits should be designed around workload, not optimistic averages. Separate ingestion, normalization, storage, alerting, and presentation so a slow dashboard does not block collection. Read quota headers, implement exponential backoff, cache nonchanging metadata, and request only required fields. For a high-frequency stream, use WebSocket subscriptions where permitted and REST for recovery or snapshots. Monitor dropped messages, stale timestamps, and sequence gaps. Rate limits often differ by endpoint and account tier, so test peak behavior and document the API pricing page before production. Never assume a successful response means complete data.
WebSocket vs. REST for Real-Time Crypto Prices
WebSocket vs. REST for real-time crypto prices is a choice between continuous events and request-based snapshots. WebSocket reduces polling overhead and can deliver trades, quotes, and order-book updates quickly, but clients must handle reconnects, sequence numbers, heartbeats, and missed messages. REST is simpler for recovery, metadata, and periodic snapshots, yet repeated requests can hit quotas and introduce delay. A resilient system combines both: stream during normal operation, detect gaps, then request a bounded REST backfill. Persist exchange event time and provider receipt time so latency and data completeness can be measured independently.
Handling API Outages Without Missing Trades
Handling API outages without missing trades requires redundancy and explicit degraded-mode behavior. Maintain a secondary provider or direct venue connection, but normalize identifiers and compare quality before switching automatically. A circuit breaker should stop new actions when timestamps become stale, sequence gaps persist, or prices diverge beyond a tested band. Queue nonurgent research requests, preserve failed payloads, and alert an operator with the affected symbols and time range. Do not silently substitute an index price for an executable venue quote. Recovery should reconcile the gap, mark uncertain records, and produce an incident report before normal automation resumes.
Historical Market Data API: Backtesting and Research Use Cases
Historical Market data API: backtesting and research use cases include strategy validation, volatility studies, index construction, event analysis, and portfolio stress testing. Choose data that preserves delisted assets, symbol changes, corporate-like token events, timezone, and revision history. A backtest should use only information available at each timestamp and should model fees, spread, slippage, funding, gas, and execution constraints. Compare multiple providers for a sample period before purchasing years of data. Historical records are evidence about possible behavior, not a promise of future returns.

Research workstation showing historical candles, event annotations, backtest metrics, drawdown curve, fees, and slippage assumptions
Granularity Options: Tick, Minute, and Daily Bars
Granularity options: tick, minute, and daily bars should match the holding period and decision rule. Tick data supports execution and microstructure studies but demands substantial storage and careful trade deduplication. Minute bars suit many intraday strategies, although candle construction can hide spread and order-book conditions. Daily bars are efficient for allocation research but cannot validate intraday fills or liquidation behavior. Confirm whether bars use first, last, volume-weighted, or exchange-specific prices, and whether empty intervals are represented. A sensible project begins with daily or hourly data, then increases resolution only when the hypothesis requires it.
Case Study: A 30-Second Delay That Cost $12K
Cost-effective storage for years of crypto data comes from separating raw, normalized, and derived layers. Compress immutable trade and candle files by date and asset, partition them for selective reads, and retain checksums for integrity. Store frequently queried aggregates in a columnar database while keeping cold history in object storage. Deduplicate repeated metadata and avoid saving identical payloads from every dashboard request. Define retention by research value and licensing terms, not convenience. A monthly quality audit should check gaps, duplicate timestamps, impossible prices, and schema drift before derived indicators are refreshed.
Real-Time Feeds vs. Delayed Snapshots: What Traders Lose
Smart data and analytics solutions: from raw feeds to insights require a chain of documented transformations. Ingest raw exchange, index, on-chain, and news data; validate schemas; normalize identifiers; calculate metrics; and expose results with lineage. Quality checks should test freshness, completeness, uniqueness, range, and cross-source consistency. Business users need definitions beside values, while developers need versioned schemas and stable identifiers. A strong system can support technical analysis, treasury reporting, compliance review, and quantitative strategies without allowing one use case to corrupt another. The goal is trusted interpretation, not merely a larger volume of unexamined records.

Data pipeline diagram moving from raw exchange and blockchain feeds through validation, normalization, metrics, and decision dashboards
Case Study: A 30-Second Delay That Cost $12K
Normalizing data across exchanges for consistency means mapping symbols, quote currencies, contract specifications, timestamps, and units before aggregation. BTC-USD, BTC-USDT, and inverse futures are not interchangeable observations. Convert time to UTC, preserve original venue identifiers, and record whether volume is base or quote currency. For order books, define depth levels and snapshot frequency; for candles, define interval boundaries and missing-bar behavior. Outlier filters should be transparent and reversible. After normalization, compare median and weighted prices, spreads, and volumes across venues. This process reduces accidental duplication while preserving information about genuine fragmentation.
When Historical Market Data API Calls Beat Live Streams
Building custom metrics with aggregated data feeds allows teams to combine market, derivatives, and on-chain observations into decision-ready measures. Examples include liquidity-adjusted momentum, stablecoin purchasing capacity, dominance breadth, basis stress, or a volatility-adjusted CMC20 trend. Define numerator, denominator, window, exclusions, and missing-data treatment in plain language before implementation. Backtest the metric against a benchmark and test whether its signal survives reasonable parameter changes. Publish a version number and calculation timestamp with every result. Custom metrics are valuable when they answer a concrete portfolio or risk question, not when they simply add complexity.
Platforms 2026: Choosing the Right Crypto Market Data Ecosystem
Platforms 2026: choosing the right crypto market data ecosystem requires matching capability to responsibility. A retail researcher may need charts, watchlists, and modest alerts; a fund may require historical depth, derivatives, entitlements, audit logs, and service-level commitments. Evaluate coverage, freshness, methodology, export rights, security, support, and total cost through a documented scorecard. Market infrastructure should be resilient enough for reporting and research, while execution systems require stricter controls and redundancy. Providers such as FactSet Research Systems demonstrate why enterprise buyers assess governance and integration, not merely the number of supported tokens.

Enterprise vendor scorecard comparing coverage, latency, APIs, governance, security, historical depth, support, and total ownership cost
Free vs. Paid Data Feeds: What You Actually Get
Free vs. paid data feeds: what you actually get depends on limits hidden behind the headline price. Free plans may provide delayed quotes, low request quotas, limited history, restricted redistribution, or no service guarantee. Paid plans can add WebSockets, higher throughput, granular history, support, and commercial licensing, but they still require quality testing. Compare equivalent fields and time windows rather than comparing plan names. A developer should prototype with free access, measure actual workload, then calculate the cost of missed data and maintenance. Pricing is only one part of suitability; reliability and legal rights can matter more.
Hidden Costs of ‘Free’ Crypto Market Data
Hidden costs of ‘free’ crypto market data include engineering time, rate-limit workarounds, stale records, manual corrections, licensing uncertainty, and opportunity cost from unreliable alerts. A feed that lacks historical continuity may force a team to rebuild archives later. A provider without support can increase incident resolution time during volatile markets. Estimate storage, monitoring, normalization, fallback sources, and analyst verification before declaring a solution free. Keep a small independent sample for quality comparison, and do not redistribute data if the terms prohibit it. Total cost becomes clearer when measured over a full reporting or research cycle.
Case Study: A 30-Second Delay That Cost $12K
When to upgrade to enterprise analytics solutions is determined by operational risk, scale, and governance rather than vanity features. Consider an upgrade when multiple teams need the same data, manual exports delay decisions, API quotas interrupt production, or regulators and clients require reproducible records. Enterprise requirements may include SSO, role-based access, audit logs, entitlements, historical revisions, dedicated support, and service-level agreements. Conduct a proof of concept using real peak workloads and failure scenarios. Confirm that the provider covers the assets and jurisdictions actually required. An expensive platform is justified only when it reduces measurable risk or creates measurable efficiency.
Real-Time Feeds vs. Delayed Snapshots: What Traders Lose
Integrating multiple sources for a unified crypto market view improves resilience but increases reconciliation work. Assign each metric a preferred source, a fallback, a timestamp rule, and a tolerance for disagreement. For example, use an index provider for benchmark prices, venue feeds for execution, blockchain data for settlement, and filings for issuer facts. Preserve original values beside the selected value so analysts can investigate divergence. A unified view should expose confidence, freshness, and source status rather than hiding uncertainty behind a single number. This design supports treasury managers, journalists, and quantitative researchers without pretending that every dataset measures the same thing.

Unified crypto data console showing multiple sources, source priority, confidence scores, timestamps, and reconciliation status
Case Study: A 30-Second Delay That Cost $12K
Avoiding data conflicts when merging feeds starts with semantic alignment. Confirm asset identity, quote currency, timestamp convention, supply definition, and whether a value represents a trade, midpoint, index, or estimate. Use deterministic source precedence for routine differences and quarantine large deviations for review. Never average incompatible contract prices or combine spot and futures volume without labeling the result. Maintain a conflict table containing source values, selected value, reason, and reviewer. Automated tests can detect changes in spread, supply, and coverage, but human review remains important when a token migrates or an exchange experiences an outage.
When Historical Market Data API Calls Beat Live Streams
Case Study: A hybrid setup with TradingView and custom API illustrates a practical division of labor. TradingView provides shared charts, alerts, and analyst annotations, while a custom service collects exchange trades, historical bars, ETF flow, and on-chain metrics for validation. The system stores raw timestamps, calculates normalized indicators, and sends only confirmed events to the charting layer. During an API interruption, alerts pause and the service marks data stale instead of substituting an unverified quote. This arrangement preserves visual usability while keeping critical calculations reproducible, testable, and independent of one dashboard vendor.
How Live Crypto Prices and Market Data Shape Trading Decisions
Frequently asked questions about crypto market data usually concern reliability, refresh rates, APIs, and interpretation. The best answer depends on whether the user is learning, trading, researching, reporting, or operating a treasury. Start by defining the decision the data must support, then select the minimum fields and resolution needed. Verify timestamp, methodology, licensing, and historical availability before building a habit around any website. Market data is not automatically correct because it looks precise; quality comes from transparent sourcing, validation, and appropriate use. The following questions focus on practical choices for live monitoring and historical research.

FAQ interface presenting practical questions about crypto APIs, refresh rates, historical data, reliability, and dashboard selection
Real-Time Feeds vs. Delayed Snapshots: What Traders Lose
FAQ: Which live market data API is best for beginners? Choose one with clear documentation, a small free tier, stable asset identifiers, readable examples, and enough historical context to validate responses. Beginners should start with REST quotes and listings, then add WebSockets after understanding timestamps, rate limits, and reconnect logic.
Check whether the provider covers required symbols, quote currencies, and global metrics. Build a test script that logs raw responses, latency, missing fields, and errors for a week. The best first API is the one that can be understood, tested, and used legally within the project’s actual scope.
Case Study: A 30-Second Delay That Cost $12K
Key features to prioritize on a budget are accurate timestamps, essential asset coverage, modest historical depth, transparent limits, and export or storage rights. A beginner may need Bitcoin and Ethereum quotes, market capitalization, volume, dominance, and a few liquid pairs rather than thousands of obscure tokens.
Prefer predictable quotas and documentation over a larger but unstable catalog. Add caching, pagination, retries, and local storage early so the free tier is not wasted. Before upgrading, measure request volume, missing data, and analyst time. This evidence makes a paid decision rational and prevents paying for unused complexity.
When Historical Market Data API Calls Beat Live Streams
Free crypto market data APIs that are still reliable should be judged through repeated tests, not reputation alone. Compare quote freshness, response completeness, historical consistency, symbol mapping, and behavior during volatile periods. Use free access for education, prototypes, and low-frequency research only when licensing permits; production applications may need paid limits and support.
Keep a second source for spot checks and record disagreements. A free API can be dependable for a narrow workload, while the same service may fail under high-frequency polling. Reliability is therefore a relationship between provider capability and the user’s request pattern.
FAQ: How Often Should I Refresh Bitcoin Dominance and Altcoin Season Index?
FAQ: How often should I refresh Bitcoin dominance and Altcoin Season Index? Refresh according to the decision horizon. Intraday traders may monitor dominance every few minutes, but the Altcoin Season Index often changes meaningfully only after its underlying lookback updates. Long-term allocators can use hourly or daily observations and avoid reacting to noise.
Always display the calculation time and source, because different providers may publish at different intervals. Store snapshots if you need to study signal persistence. A refresh schedule should reduce unnecessary API usage while remaining fast enough to capture the market regime relevant to the strategy.
When Historical Market Data API Calls Beat Live Streams
Intraday vs. daily monitoring cadence should reflect signal half-life and execution speed. Bitcoin dominance can move during a sharp rotation, so active traders may watch it alongside price and volume throughout the session. The Altcoin Season Index, based on a broader lookback, is generally more useful as a regime indicator than a tick-by-tick trigger.
Daily investors can review both after a consistent market close and compare with weekly trends. Avoid mixing intraday values with end-of-day returns in one analysis. The correct cadence is the slowest schedule that captures the decision without creating avoidable noise, cost, or emotional reactions.
Automating Alerts for Threshold Breaches
Automating alerts for threshold breaches begins with a precise rule: define metric, source, threshold, comparison window, confirmation count, and cooldown. For example, notify when dominance exceeds a level for three consecutive observations and total capitalization confirms the direction.
Include current value, prior value, timestamp, source health, and a link to the relevant dashboard. Test alerts with historical replays and synthetic failures before relying on them. Route urgent events separately from informational updates, and require human approval for trades. An alert should make review faster, not replace judgment or bypass portfolio risk controls.
FAQ: Can Historical Market Data API Predict Future Crypto Trends?
FAQ: Can historical market data API predict future crypto trends? No API predicts the future; historical data can reveal patterns, estimate risk, and test hypotheses under prior conditions. A backtest may show that rising breadth, falling dominance, or persistent ETF flow preceded certain outcomes, but relationships can break when market structure, regulation, liquidity, or participants change.
Use walk-forward testing, out-of-sample periods, realistic costs, and multiple regimes. Treat any forecast as a probability distribution with uncertainty rather than a promise. Historical evidence is most useful when it improves sizing, scenario planning, and discipline instead of encouraging false precision.
Limits of Backtesting in Fast-Moving Markets
Limits of backtesting in fast-moving markets include survivorship bias, look-ahead bias, stale prices, unavailable liquidity, changing fees, and unstable correlations. Token universes evolve, exchange outages occur, and a strategy that worked during abundant liquidity may fail during stress. Model spread, market impact, funding, gas, latency, and partial fills rather than assuming every signal executes at the closing price. Keep a strict separation between training and evaluation data, and report drawdown and turnover alongside return. A credible backtest makes failure conditions visible and avoids presenting a favorable historical curve as a forecast.
Choosing Widgets for Crypto Total Market Cap
Combining historical and live feeds for edge means using history to define and validate a rule, then using live data to apply it without changing the rule opportunistically. Align schemas, timestamps, symbols, and revisions across both systems. Monitor live distribution drift: volume, volatility, spreads, and asset breadth may differ materially from the training period. Set kill switches when data quality fails or model assumptions leave their tested range. Review predictions against outcomes in a paper or limited-risk environment before scaling. The durable advantage is usually disciplined measurement, robust execution, and rapid error detection rather than a mysterious indicator.